TEMPLATE
TEMPLATE. 3. Process Analysis. Creating a Process Analysis infographic provides the opportunity to -carefully examine the steps in a process or sequence of events -select the most vital steps in that process or sequence of events

TEMPLATE
E N D
Presentation Transcript
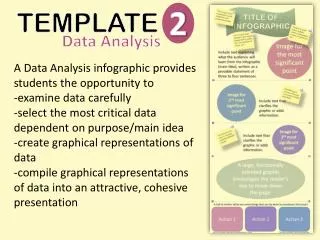
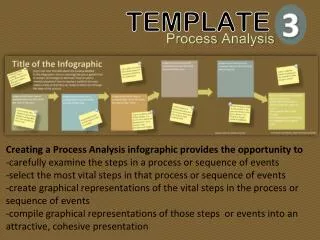
TEMPLATE 3 Process Analysis • Creating a Process Analysis infographic provides the opportunity to • -carefully examine the steps in a process or sequence of events • -select the most vital steps in that process or sequence of events • -create graphical representations of the vital steps in the process or sequence of events • -compile graphical representations of those steps or events into an attractive, cohesive presentation
Title of the Infographic Insert text here that tells about the process detailed in this infographic. Are you showing how play a game? How to convert percentages to decimals? How to solve a chemical equation? How to resolve a conflict? Get your readers ready so that they are ready to follow you through the steps of the process. Image should show how to complete Step One OR clarify the idea of Step One. Image should show how to complete Step Two OR clarify the idea of Step Two. Make your title snappy! This is your first chance to get your reader’s attention! Replace colored boxes with critical text and images, or put the images and text on top of the boxes. You decide! Go to Insert, then Shapes to get various shapes and symbols. You can change the colors, too! Add graphics that reinforce your topic or process.
Image should show how to complete Step Four OR clarify the idea of Step Four. Image should show how to complete Step Three OR clarify the idea of Step Three. If your graphics are fairly simple, it is OK to use a patterned background. Go to Design, then Background Styles White space is a design element, but too much white space leaves your page looking bare. Experiment with your backgrounds, but keep patterns small and consistent. Your goal is to make the process easier for someone to follow or to understand.
Image should show how to complete Step Six OR clarify the idea of Step Six. For your final spot, you should -draw a conclusion -clarify WHY the process is significant for the reader to know -leave reader with a final thought -provided a graphic that brings the infographic to a logical close Some variety is good, but be careful to not get too CRAZY with your design. You might give your reader a headache! Add or subtract shapes according to the number of steps in your process. • First and Last Name, Class Period and Date • Leave room to credit sources