SIGNAL DETECTION THEORY
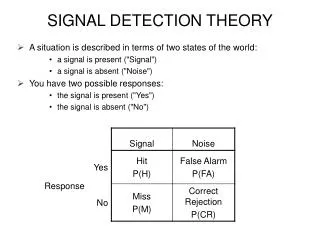
SIGNAL DETECTION THEORY. A situation is described in terms of two states of the world: a signal is present ("Signal") a signal is absent ("Noise") You have two possible responses: the signal is present ("Yes") the signal is absent ("No"). The theory assumes that what you are doing is:

SIGNAL DETECTION THEORY
E N D
Presentation Transcript
SIGNAL DETECTION THEORY • A situation is described in terms of two states of the world: • a signal is present ("Signal") • a signal is absent ("Noise") • You have two possible responses: • the signal is present ("Yes") • the signal is absent ("No")
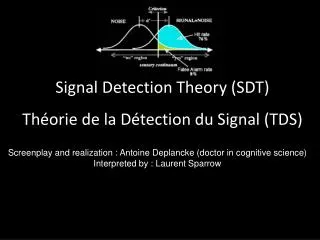
The theory assumes that what you are doing is: • First, you collect sensory evidence concerning the presence or absence of the signal. • Next, you decide whether this evidence constitutes a signal. This means that you must have some criterion C that you use as a "cutoff": if the evidence is less than C, you decide "No"; if the evidence exceeds C, you decide "Yes".
Measures of Performance in SDT: • 1. Response bias (b) • We can describe performance in terms of response bias: you may be prone to say "yes" (which is "risky") or you may be prone to say "no" (which is "conservative"). • Response bias the ratio of the heights of the two curves at the cutoff point and is measured by the quantity: P(X/S) • ß = * P(X/N) • where X = "evidence variable” • S = signal • N = noise *Note: your book has a “simplified” equation for representing . You may refer to whichever best helps you understand the concept of response bias.
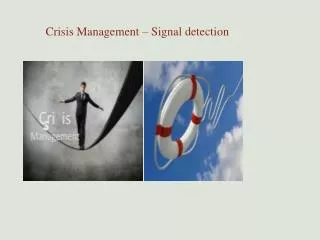
Studies of human performance show that humans do change β in response to changes in probabilities and payoffs ‑‑ but not as much as they should! • This phenomenon is called sluggish beta. • Note: the terms “risky” and “conservative”refer only to a person’s propensity to say “yes (signal)” or “no (noise).” • Examples: • radiologists reading x-rays for signs of tumors • radar operators on a battle ship looking for incoming enemy aircraft • scanning a parking lot for a parking space
The cutoff (C) for determining the presence of a signal vs the response bias parameter (ß). • Not the same but correlated. • “Risky“ strategy: ß ↓ and C ↓ • More conservative: both C and ß ↑ • Setting β • Strategy can be affected by relative costs and values assigned to outcomes. • Examples: • radiologists reading x-rays for signs of tumors • radar operators on a battle ship looking for incoming enemy aircraft
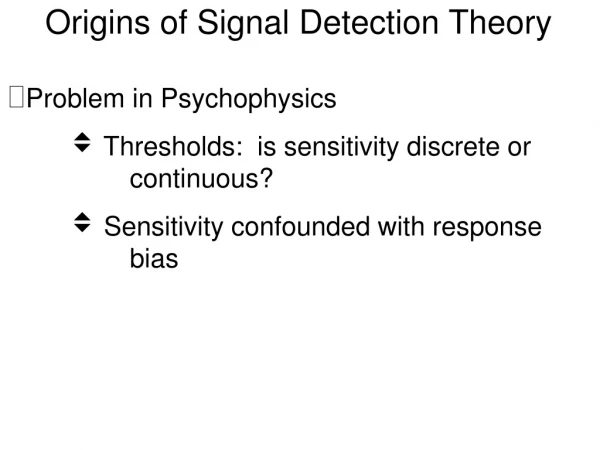
Measures of Performance in SDT: 2. Sensitivity (d’) • Signal detection theory distinguishes response bias from sensitivity • a function of the keenness or sensitivity of the human's detection mechanisms and the relative strength of the signal in noise. • For example, a person may be "risky" (i.e., prone to say "Yes, I detect a signal") but may have bad eyesight (or be looking at a very fuzzy screen) and thus may often miss signals because of this low sensitivity. • Table 4.5 on page 84 of your textbook gives some possible values of d’ corresponding to observed P(H) and P(FA). This value may also be calculated from the probabilities of a hit and a false alarm.
Receiver Operating Characteristic (ROC) curve • Plots the probability of a hit against the probability of a false alarm. • Each curve represents the same sensitivity at different levels of response bias.
Your Turn …. • An experiment was performed to determine how students who participated in a distance learning course responded to a signal from the instructor indicating that they had been “called on” to respond to a question. The results for two of the students using a particular type of signal and with varying feedback (i.e., “rewards” for responding) are given in the table below. Plot the results for both students on the same ROC curve. Who is more sensitive? Identify “risky” and “conservative” behavior. Comment on the results.