Download
1 / 88
880 likes | 1.05k Vues
Chapter 6 Views of Earth. Sections 2 & 3: Latitude and Longitude and Maps. Latitude. The equator is an imaginary line that circles the Earth halfway between the north and south poles. It separates the Earth into two equal halves – the northern hemisphere and the southern hemisphere.

E N D
Chapter 6 Views of Earth Sections 2 & 3: Latitude and Longitude and Maps
Latitude • The equator is an imaginary line that circles the Earth halfway between the north and south poles. It separates the Earth into two equal halves – the northern hemisphere and the southern hemisphere. • Latitude is the distance, measured in degrees, north or south of the equator. These lines are horizontal, parallel, and never intersect. • The equator is 0 degrees latitude and the poles are 90 degrees latitude. • Locations north and south of the equator are referred to by degrees north latitude or degrees south latitude. The degrees are further broken down into minutes and seconds.
Longitude • The prime meridian is an imaginary line that runs vertically from the North Pole through Greenwich, England, to the South Pole. This line separates east from west. • Longitude is the distance east or west of the prime meridian. These lines are vertical and never intersect, but the lines do meet at the poles. • Longitude is measured from 0 degrees to 180 degrees. The prime meridian is 0 degrees longitude. Points east or west of the prime meridian are referred to by degrees east longitude or degrees west longitude. • Unlike the equator, the prime meridian does not circle the Earth. The line of longitude on the opposite side of Earth from the prime meridian is 180 degrees longitude, call the International Date Line.
Finding Locations • Latitude is written first in a coordinate set. • Latitude is given north or south of the equator. Longitude is given east or west of the prime meridian. • Examples: 30degrees N, 90degrees W = New Orleans, Louisiana
Time Zones • Time is measured by tracking Earth’s movement in relation to the Sun. Each day has 24 hours, so Earth is divided into 24 time zones. • Each time zone is 15 degrees of longitude wide and is 1 hour different from the zones beside it. • The United States has 6 different time zones. As you travel from east to west across the U.S., you lose an hour. Ex. 5 pm Eastern Time is 4 pm Central Time is 3 pm Mountain Time is 2 pm Pacific Time. • When you travel across the International Date Line, you gain or lose a whole day. If you travel west across the International Date Line, you move forward one day. If you travel east across the Line, you move back one calendar day. Ex: If you flew from Hawaii on a Friday, it would be Saturday when you landed in Australia.
On the handout find the continent using the following coordinates 60o N, 140o W : 20oN, 20oW : 20oS, 60oW : 40oS, 140oW : 50oN, 20oW : 80oS, 120oE : 20oS, 20oE: 0o, 80oE :
Maps • Maps are models of Earth’s surface. The most perfect map is a globe. • Maps are made as map projections. A map projection is made when points and lines on a globe’s surface are transferred onto paper. • There are three main types of map projections and all of them distort the shape of the landmasses of their areas.
Mercator Projections • Mercator map projections are used mainly on ship. • They project the correct shape of the continents, but the areas are distorted. • Longitude lines are projected as parallel, making the areas near the poles look much larger than they are.
Robinson Projections • A Robinson projection shows accurate continent shapes and more accurate land areas. • In this projection, the lines of longitude are curved as they are on a globe, which results in less distortion near the poles.
Conic Projection • Conic projections are made by projection points and lines from a globe onto a cone. • These are used to make maps of small area, like road maps weather maps.
Topographic Maps • Topographic maps are detailed maps showing the elevations of hills and valleys of an area. • They use lines, symbols, and colors to represent changes in elevation and features onEarth’s surface.
Each line that shows a different elevation is called a Contour Line
The spaces between the contour lines are the Contour Interval Not all contour lines are marked with the elevation. The ones that are labeled are called the index contours. You can determine the elevation of other lines by adding or subtracting the contour interval from the elevation on the index contour. Contour Interval
Depression Contour • This is shown by contour lines with short lines coming from it hachures (the lines point in the direction of the depression)
Rules of Topographic Maps • They never cross or touch!!! • When they are close together, it means that it is a steep elevation. • 3. When they are far apart, it means it is flatter land • 4. When the contour lines make a V shape, it means there is a river
Topographic Maps • A topographic map shows the changes in elevation of Earth’s surface. • These maps show natural features and also cultural features, such as roads, cities, and other structures built by people. • These maps are helpful when doing outdoor activities like hiking. • A contour line is a line on topo a map that connects points of equal elevation. • The difference in elevation between two side-by-side contour lines is the contour interval, which stays constant throughout a map. • Not all contour lines are marked with the elevation. The ones that are labeled are called the index contours. You can determine the elevation of other lines by adding or subtracting the contour interval from the elevation on the index contour.
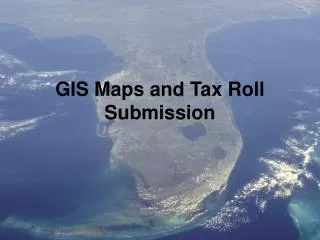
Map Scale • The map scale is the relationship between the distances on the map and distances on Earth’s surface. • Example: A topo map has a scale that reads 1:80,000. This means that one unit on the map represents 80,000 units on land.
Map Legend • A map legend explains what the symbols used on the map mean. Examples of map symbols are Roads, Boundaries between counties, cities, states, buildings, etc
Map Series • Topo maps are made to cover different amounts of the Earth’s surface. • The map series includes maps that measure the same area of the surface. • Example: A series may include 7.5 minute maps. These cover 7.5 minutes of latitude by 7.5 minutes of longitude of Earth’s surface.
100 ft Side View of my Mountain 75 ft 50 ft 25 ft Mountain on a Topographic Map
The Geologic Time Scale • It is generally accepted now that Earth is about 4.6 billion years old.
The Geologic Time Scale • By studying the characteristics of rocks and the fossils within them geologists can begin to reconstruct Earth’s history
The Geologic Time Scale • Geologic time scale is a record of Earth’s history from 4.6 billion years ago to the present
Geologic Time • In order to quantify such a vast amount of time Earth’s long history is divided into specific units.
Geologic Time • These units are not absolute dates but records that increase or decrease in relation to each other based on the rock record and fossil data discovered.
Geologic Time • The names of the periods do not change, but the years marking the beginning and ending of each are continually being refined as more data become available
Eons • An eon is the largest unit of time and is measured in billions of years. There are four Eons in Earth’s History.
Eons • Archean Eon spans 3.8 billion years to 2.5 billion years B.P.
Eons • No fossils of any kind
Eons • Proterozoic Eon spans 2.5 billion years to 540 million years BP
Eons • Bacteria-like organisms form, several episodes of mountain building
Eons • Phanerozoic Eon spans from 540 million years to present
Eons • 90% OF Earth’s history falls in the Archean and Proterozoic Eons. This is referred to as Precambrian Time.
Eras • An era is the next longest span of time. It is measured in hundreds of millions of years.
Eras • Eras are defined by differences in life forms found in rocks. There are three eras in the Phanerozoic Eon
Eras • Paleozoic Era spans 540-245 million years BP
Eras • The Paleozoic Era marked the dominance of animal life in the oceans as plants began to take over the continents
Eras • Mesozoic Era spans 245-66 million BP
Eras • The Mesozoic Era marks the dominance of the dinosaurs on land
Eras • Cenozoic Era spans 66 million years to present
Eras • The Cenozoic Era marks the dominance of mammals
Periods • Periods are defined by the life forms that were abundant or became extinct at the time in which specific rocks were deposited. They are measured in tens of millions of years.
Periods • The Paleozoic Era has 7 periods