Download
1 / 18
180 likes | 301 Vues
Population Estimates October 2007 Orleans Parish and Metro Area. Population of Orleans Parish. GCR estimates that the population of New Orleans rose to 288,057 in October, 2007. This figure represents 63% of the city’s July 2005 population.

E N D
Population Estimates October 2007 Orleans Parish and Metro Area
Population of Orleans Parish • GCR estimates that the population of New Orleans rose to 288,057 in October, 2007. This figure represents 63% of the city’s July 2005 population. • The city gained approximately 14,500 residents (5%) between July 1, 2007, and October, 2007.
Recovery of Population • The repopulation of the city has progressed steadily since Hurricane Katrina. • The rate at which residents are returning has yet to slow significantly; in fact, the last few months have seen an increase in that rate.
Repopulation by Flood Depth • The degree to which areas have repopulated is almost directly related to the amount of flooding they received following Katrina. • Areas with the most flooding have experienced the highest rates of growth over the last year.
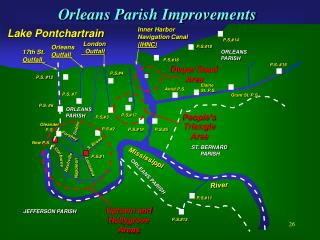
Neighborhood Recovery Eastbank Neighborhoods with Highest and Lowest Rates of Repopulation • Neighborhoods with significant flood damage have been slow to repopulate. In several of these neighborhoods, fewer than one-third of residents have returned. • Areas closest to the river, where flooding was minimal, recovered their population quickly and have regained nearly all of their pre-storm residents. • On the Westbank, where no significant flooding occurred, the population has exceeded its pre-Katrina level as a whole and in virtually every neighborhood.
Metropolitan Area Population • The New Orleans metropolitan area has reached 86% of its pre-Katrina population. • St. Tammany and Tangipahoa parishes have exceeded their pre-storm populations by significant margins. • Jefferson and Plaquemines parishes are approaching their 2005 populations. • St. Charles and St. John the Baptist parishes have experienced modest growth. • In the most heavily damaged parish, St. Bernard, just over one-third of the pre-Katrina population has returned. Population of New Orleans Metro Area* * Area includes Tangipahoa Parish.
Voting Patterns Confirm Population Trends • On October 20, 2007, approximately 76,000 New Orleanians voted in the gubernatorial primary election. This number represents about 56% of the number that voted in the same primary in fall 2003. • The discrepancy between this percentage and that of pre-storm residents that have returned (63%) can potentially be attributed to lower turnout statewide. Turnout in most other metro area parishes was lower in this past election than in 2003. Votes Cast in Gubernatorial Primary Elections
Voting Patterns Confirm Population Trends • In major elections, Orleans Parish typically lags slightly behind the state in votes cast per capita. • The fact that the 2007 gubernatorial election parallels this trend suggests that GCR’s population estimate for Orleans is accurate. Votes Cast as a Percentage of Overall Population
Resettlement Patterns • GCR tracks activity in the city on a block-by-block basis; therefore, we have been able to monitor the pace at which each area of New Orleans has repopulated. • Soon after the storm, the population in areas with little or minimal flood damage returned rapidly. • Throughout the recovery period, proximity to repopulated areas has been a critical component to the recovery of damaged areas. The repopulation has radiated from largely unaffected areas into blocks and neighborhoods connected to these areas. • Accordingly, areas disconnected from largely recovered areas have been slow to regain their population. This condition is most acute in the Lower Ninth Ward and parts of Gentilly.
Snapshots of Recovery • The following five slides contain maps of the city at five dates: July 1, 2006; October 1, 2006; March 1, 2007; July 1, 2007; October 1, 2007. These maps demonstrate the trends described in the previous slides; namely, the fact that repopulation has radiated outward from areas which recovered quickly after the storm. • In each of these maps, red represents areas in which activity is less than 20% of its pre-Katrina level. Green represents areas in which activity is greater than 80% of its pre-Katrina level. Yellow and orange display areas in between. • Boundaries of New Orleans City Council Districts are also displayed.
GCR & Associates, Inc. Gregory C. Rigamer grigamer@gcrconsulting.com 504.304.2500 800.259.6192 fax 504.304.2525 2021 Lakeshore Drive New Orleans, LA 70122 UNO Research & Technology Park Advanced Technology Center