Download
1 / 20
200 likes | 343 Vues
Population Estimates for December 2007 Orleans Parish and Metro Area. New Orleans Metro Area 2008. As we approach January 1, 2008, the population of the metro area continues to rebound from the impact of Hurricane Katrina.

E N D
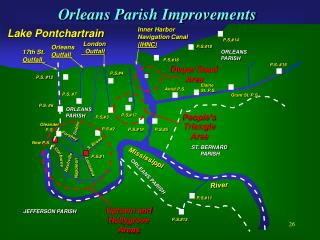
Population Estimates for December 2007 Orleans Parish and Metro Area
New Orleans Metro Area 2008 • As we approach January 1, 2008, the population of the metro area continues to rebound from the impact of Hurricane Katrina. • An estimated 1,236,505 residents (87% of the pre storm population) are located in the 8 parishes in the New Orleans metro area (including Tangipahoa Parish). • The distribution of the population has shifted among the parishes with Jefferson becoming the largest, followed by Orleans and St. Tammany. These three parishes now represent 78 Percent of the metro area population.
2007 Voting Patterns Confirm Current Population Estimates • A comparison of October 2003 and 2007 voting activity generally parallels a comparison of pre- and post-Katrina population by parish. • The New Orleans area’s “share” of statewide votes cast in 2007 was 87% of its share of 2003 votes – a figure that is nearly identical to its estimated population Metro Area* Population and Votes Cast in Gubernatorial Primaries * Area includes Tangipahoa Parish.
Voting and Resettlement Patterns Prove to be Consistent in 2007 • The percentage of votes cast in 2007 compared to 2003 closely mirrors the return of population in each parish. • The most heavily damaged parishes – Orleans, St. Bernard, Plaquemines – show diminished votes cast • The less heavily damaged parishes are near or slightly above pre-Katrina votes cast
Population of New Orleans • The repopulation of the City has progressed steadily since Hurricane Katrina. • The rate at which residents are returning has yet to slow; redevelopment activity is progressing throughout New Orleans
Imminent Population Trends Examples of U.S. cities with populations of approximately 300,000 - 350,000 • Based on recent monthly changes in population, the population of New Orleans should exceed 300,000 in the first quarter of 2008 • Exceeding the 300,000 threshold will constitute a major milestone and will restore New Orleans to the cohort of “major” central cities
Voting and Population Trends are Consistent • While the residential “activity index” is a primary source for GCR’s population estimates, votes cast in recent elections provide another measure of the number of people in the community. • A comparison of the number of votes cast in the gubernatorial primary elections in 2007 and 2003 provides an interesting insight into the population of New Orleans. • While fewer votes were cast in the 2007 gubernatorial election in Orleans Parish, the ratio of votes cast to resident population remained constant. Population and Votes Cast in Gubernatorial Primaries
Relative Voting Activity byCouncil District • An examination of population and voting activity by Council District highlights the voter “participation rate” for each Council District • When measured against resident population, pre- and post-Katrina voting patterns by Council District have remained relatively constant. Comparison of pre- and post- storm votes cast and population by Council District* *Note: This table provides estimated population for December rather than October of 2007.
Post Election Voting Data Confirms Population Trends • Voting and resettlement patterns at the neighborhood level are very similar. • The following slides provide illustrations of post-Katrina activity by neighborhood according to two metrics: • Residential “activity index” (rate of resettlement) • Votes cast in the 2003 and 2007 gubernatorial primaries • As would be expected, resettlement patterns and votes cast are directly related throughout the City. • In both maps, red represents areas of less activity. Green represents areas of greater activity.
Votes Cast in Gubernatorial Primary: October 2007 as Percentage of October 2003 Red = <25% Orange = 25%-50% Yellow = 50%-75% Light Green = 75%-100% Bright Green = >100%
Snapshots of Recovery • The following slides illustrate resettlement patterns in the City over time: July 2006 thru December 2007. These maps demonstrate how repopulation has radiated outward from areas which recovered quickly after the storm. • In each of these maps, red represents areas in which activity is less than 20% of its pre-Katrina level. Green represents areas in which activity is greater than 80% of its pre-Katrina level. Yellow and orange display areas in between. • Boundaries of New Orleans City Council Districts are also displayed. To illustrate neighborhood level repopulation trends, neighborhood boundaries have been provided for the most recent month.
GCR & Associates, Inc. Gregory C. Rigamer grigamer@gcrconsulting.com 504.304.2500 800.259.6192 fax 504.304.2525 2021 Lakeshore Drive New Orleans, LA 70122 UNO Research & Technology Park Advanced Technology Center