Download
1 / 39
410 likes | 663 Vues
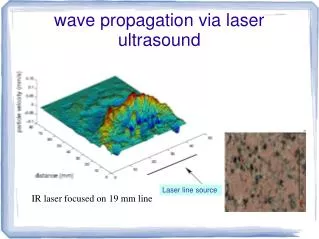
wave propagation via laser ultrasound. Laser line source. IR laser focused on 19 mm line. Transmitted EM phase image of granite at 150 GHz. JS, M. Batzle, M. Prasad, N. Greeney & A. Yuffa Colorado School of Mines.

E N D
wave propagation via laser ultrasound Laser line source IR laser focused on 19 mm line
JS, M. Batzle, M. Prasad, N. Greeney & A. Yuffa Colorado School of Mines Measuring electrical and mechanical properties of rocks on the submillimeter scale Collaboration between Physics, Geophsysics and Petroleum Engineering
All data and software will be available • http://mesoscopic.mines.edu • http://physics.mines.edu/~jscales • Common Ground free database of rock properties
High spatial resolution techniques now available • Laser ultrasound • millimeter/submillimeter wave EM • Strain microscopy • Acoustic microscopy (Prasad) • Micro-CT scan (Batzle)
Motivation • Complimentary measurements • Submillimeter waves sample on same length scale as ultrasound. • measurements fully noncontacting and can be done on same samples without other preparation.
Length scale of measurement easily controlled optically 'low' frequency normal mode
Laser spot size measured in microns 'high' frequency normal mode
Electrical properties at sub-mm resolution • CSM submillimeter system covers from microwaves (8-10 GHz) to 1 THz (1000 GHz) • Allows us to do bulk dielectric spectroscopy • And now, near-field scanning
ABMillimetre submm VNA Funded by NSF MRI
Unique instrument • measure amplitude and phase of the electric field over broad range of millimeter to submillimeter wave frequencies • In free-space or in waveguide • Produces linearly polarized Gaussian beams of high optical quality: quasi-optics • Allows 'easy optics'
Dielectric spectroscopy Fit E field with 1D Fabry-Perot model to get complex permittivity
MMW rock physics applicationsScales and Batzle APL papers • Measure organic content in rocks and oil/water emulsions • Resolve sedimentation at the 100 micron level (implications for climate models) • Check mixing models (such as Maxwell-Garnett)
Recent: cavity perturbation • Have recently built ultra-high-Q millimeter wave cavity for measuring (e.g.,) conductivity of thin films. • Use ultrasonic cavity perturbation to measure minute changes in samples
First work at 150 GHz • Greeney & JS, Appl. Phys. Letts. • Bare teflon probes • Later, went to higher frequency, 260 GHz • Clad teflon in aluminum • Small hole at tip to prevent leakage • Weiss et al, J. Appl. Phys. • Finite element modeling of tip surface coupling
True near-field scanning Tip-sample distance .2mm Wavelength about 1 mm
Circular drum modes Tip-sample distance .6mm
small scale effects of Pyrolisis McEvoy et al, 2009 oil shale conf.
Pulsed laser sources • Pulses from 10 ns to 100 fs • Looking at first arriving energy as we scan across the sample. • Scanning resolution measured in nm
Measuring spatial strain in real time at video frame rates Electronic Speckle Pattern Interferometry • Illuminate a surface with laser speckle • Take a picture of the speckle • Apply a strain • Take another picture • Subtract the two • The result is an interferogram
Speckle interferograms of concrete Are grains floating?
conclusion • Are acquiring independent high-spatial resolution data sets for relevant rocks • Expect to have high-res mechanical properties soon. • Batzle now has micro-CT scanner. Again, no rock prep required. • Have a high-speed video camera for the ESPI