Download
1 / 8
80 likes | 230 Vues
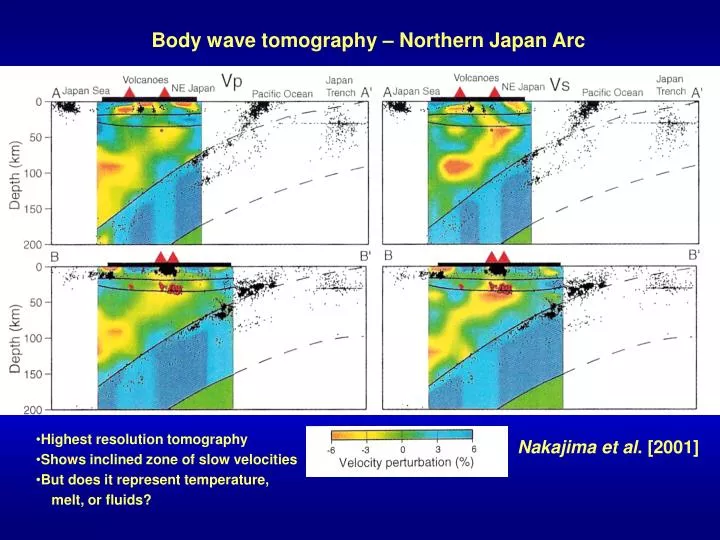
Body wave tomography – Northern Japan Arc. Highest resolution tomography Shows inclined zone of slow velocities But does it represent temperature, melt, or fluids?. Nakajima et al . [2001]. Studies linking seismic velocities and temperature often use a single value of dV/dT

E N D
Body wave tomography – Northern Japan Arc • Highest resolution tomography • Shows inclined zone of slow velocities • But does it represent temperature, • melt, or fluids? Nakajima et al. [2001]
Studies linking seismic velocities and temperature often use a single value of dV/dT • However, dV/dT has strong temperature dependence due to anelastic contribution • So we can get very low velocities at high temperatures, small grain sizes • = dlnVs/dlnVp = % change Vs/ %change Vp > 1.6 are often said to indicate melt • Experimental results show we can also get large values without melt Temperature and grain size dependence of dV/dT dVs/dT vs Temperature dlnVs/dlnVp vs Temperature Anharmonic Calculated using results from Faul et al. [2005]
Melt Geometry affects melt/velocity relation as well as porosity/permeability S velocity derivative wrt melt q < 60 Node q % change Vs -------------- % change Vp Tubule is ratio of solid bulk modulus to liquid bulk modulus After Takei [2002]
Shear Velocity Reduction and Attenuation for Olivine containing Melt Modulus Reduction and Attenuation Mechanism Melt and seismic attenuation • Line thickness gives melt content; • line color gives grain size • For a given grainsize, 1% melt gives nearly an order • of magnitude increase at 1 Hz • Seismic velocity reduction occurs through • both “melt squirt” and grain boundary sliding Faul et al., 2004
P,S, and Q Tomography - Tonga Arc Velocity tomography from Conder and Wiens [2005]; Q tomography from new tomographic Inversion of data from Roth et al [1999]
Temperature Model Geodynamic Modeling of Tomographic Velocities Model From J. Conder S velocity calculated from temperature model P velocity calculated from temperature model Relations From Faul et al 2005 Tomography From Conder & Wiens 2006
Modeling Attenuation Structure Calculated Q model (temperature effect only) Temperature model Q tomography
Thoughts • Low velocity regions in arcs, spreading centers do represent melt production • and transport regions • It is difficult to assign porosity due to lack of experimental results on the • seismic properties of partially molten peridotites • It is probably difficult to obtain upper mantle low velocities without SOME • porosity but can we really rule out very low porosity (< 0.1%)? • It is essential to understand melt geometries as a function of melt fraction • Beware of circular reasoning • -- seismologists interpreting results to be consistent with models • -- modelers assigning porosity to be consistent with seismological results