Download
1 / 8
PROBE Charts for Sustainable Performance Scorecard: End of Season 2010-2011
80 likes | 182 Vues
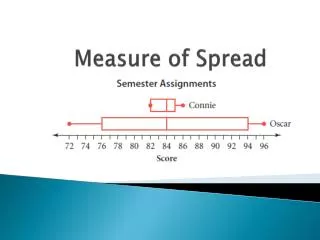
Explore the spread of scores through PROBE's site tool software, analyzing Gap Analysis with PSB-Lite. Understand sustainable performance using charts for the season's end. Contact info@probe-network.com for more insights.
Télécharger la présentation 
PROBE Charts for Sustainable Performance Scorecard: End of Season 2010-2011
An Image/Link below is provided (as is) to download presentation
Download Policy: Content on the Website is provided to you AS IS for your information and personal use and may not be sold / licensed / shared on other websites without getting consent from its author.
Content is provided to you AS IS for your information and personal use only.
Download presentation by click this link.
While downloading, if for some reason you are not able to download a presentation, the publisher may have deleted the file from their server.
During download, if you can't get a presentation, the file might be deleted by the publisher.
E N D
Presentation Transcript
PROBE Site Tool software Explaining “Spread of Scores” www.probe-network.com info@probe-network.com
PROBE Charts for PSB-Lite: Gap Analysis Sustainable Performance Scorecard
0 20 40 60 80 100
PROBE Charts for PSB-Lite: Gap Analysis Sustainable Performance Scorecard
PROBE Site Tool software Explaining “Spread of Scores” www.probe-network.com info@probe-network.com


More Related