Download
1 / 55
550 likes | 718 Vues
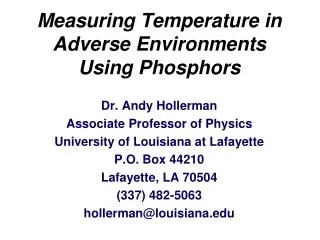
Measuring Temperature in Adverse Environments Using Phosphors. Dr. Andy Hollerman Associate Professor of Physics University of Louisiana at Lafayette P.O. Box 44210 Lafayette, LA 70504 (337) 482-5063 hollerman@louisiana.edu. Outline. Fluorescence Based Engine Health Monitoring :

E N D
Measuring Temperature in Adverse Environments Using Phosphors Dr. Andy Hollerman Associate Professor of Physics University of Louisiana at Lafayette P.O. Box 44210 Lafayette, LA 70504 (337) 482-5063 hollerman@louisiana.edu
Outline • Fluorescence Based Engine Health Monitoring: • Derived from several presentations by S.W. Allison from Oak Ridge National Laboratory (ORNL) and W.A. Hollerman. • LED Excitation of High Temperature Luminescent Coatings: • Derived from a presentation by S.W. Allison from ORNL.
W. A. Hollerman UL Lafayette
Thermometry Method • Researchers have found a method that relies on measuring the rate of decay of the fluorescent response of an inorganic phosphor as a function of temperature. • Having calibrated the phosphor over the temperature range of interest, a small surface deposit of phosphor is excited with a pulsed laser and the fluorescent decay is measured (typically in less than 1 ms) to calculate the temperature of the substrate. • Often temperature measurements are made using thermocouples or optical pyrometry. However, in situations where rapid motion or reciprocating equipment is present at high temperatures, it is best to use other techniques. • The time needed to reduce the light intensity to e-1 (36.8%) of its original value is defined as the prompt fluorescence decay time and is often a strong function of temperature.
0.2 0 -0.2 -0.4 -0.6 -0.8 -1 -1.2 0 500 1000 1500 2000 2500 3000 3500 4000 Time (µs) Phosphor Calibration Signal (V) 575 nm 453 nm 480 nm • Oven temperature is steadily increased and monitored using a Type S thermocouple located near the phosphor. • At a known temperature, the fluorescent decay signal is captured from the oscilloscope. • The lifetime of the response is then calculated using a National Instruments LabVIEW program. • The lifetime values are then plotted (on a log scale) versus the temperature to obtain the calibration curve. • The region past the “knee” of the curve has a nearly linear relationship between temperature and the lifetime and is best for temperature measurement. Signal from 453, 480, 575 nm emissions from YAG:Dy (0.27%) at 1,039 °C 1000 100 480 nm Lifetime (µs) 575 nm 10 1 0 200 400 600 800 1000 1200 1400 1600 1800 Temperature (C) Fluorescence lifetime of 480 and 575 nm from YAG:Dy (0.27%) versus temperature
Measurement Challenges • Relatively small phosphor light emission • Additional contribution of blackbody temperature to mask the light emission of the phosphor coating. • Binder must withstand challenging environments: • Vibrations, • Chemical exposure, • Radiation, and • Extreme temperatures. Signal and background from 453 nm emission in YAG:Dy (0.27%) at 1,306 °C
Fluorescence Decay Time ZnS:Mn ZnS:Mn • Temperature sensitivity is often determined through the characterization of the prompt fluorescent decay time (lifetime - ). • Sensitivity can range from cryogenic temperatures up to approximately 2000 K. • Phosphor thermometry allows temperature measurement through flames and large black body backgrounds. t t
YAG:Ce FluorescenceDecay Time (Hollerman et al., IEEE TNS, August 2003)
Fluor Paint Grain Size Measurement S Eu Y • Y2O2S:Eu fluor and polysiloxane paint on a glass slide • 2 MeV proton beam • 2 x 2 µm beam area • µPIXE images • Y, S, and Eu - fluor • Si and Ca - slide • 1.7 MV 5SDH-2 Pelletron accelerator in Louisiana 10 µm Ca Si
Phosphor Characterization SEM AFM • Y2O2S:Eu and polysiloxane paint sample. • 30 x 30 µm Atomic Force Microscope (AFM) image • Fluor grain size is less than 10 µm in extent. • Gold-coated Y2O2S:Eu and polysiloxane paint sample. • Small bright clusters represent individual yttrium fluor grains. • Fluor grain size less than 10 µm. • Magnification of 3,000.
Evaluating Temperature Limits • A series of samples were prepared to evaluate the temperature limits for the various material combinations. • The samples were heated to 1200 ºC. A UV lamp was used to excite the samples after heating to determine if the phosphor survived the heating. • The process was repeated at 1300 ºC, 1400 ºC, and 1500 ºC. • It can be seen that with increasing temperature fluorescence decreases, but still produces enough light to make a temperature measurement. ZYP Coatings ZAP Binder Y2O3:Eu
YAG:Cr phosphor paint emitted fluorescence for a repeated exposure near a hydrogen flame at 2,200 °C.
YAG:Dy and ZAP Results • YAG:Dy phosphor powder • 100% ZAP binder • Applied to ceramic substrate using a standard airbrush. • The mixture is airbrushed on to surface. • The painted substrate is then heated for 1 hour at 900 °C to cure the binder. 1,600 °C 1,500 °C 1,400 °C Three heated samples excited by UV light. Three coated samples after heating.
Example Emission Spectra YAG:Ce YAG:Eu FWHM = 100 nm lc = 525 nm Peaks at 592, 610, 631, 697, and 710 nm Intensity Intensity Wavelength (nm) Wavelength (nm) Data Taken for the NASA Glenn Research Center Fluor paints sprayed on a YSZ substrate and excited by a UV lamp.
LED Excitation of High Temperature Luminescent Coatings S. W. Allison ORNL A. Heyes Imperial College A. Hollerman UL Lafayette
Rationale Light Emitting Diodes (LEDs). For the high temperature and difficult environments that turbine engines present, until recently, an expensive and unwieldy laser was required for luminescent thermometry. However, technological developments have recently led to the availability of high brightness light emitting diodes (LEDs). This development expands the opportunities and measurement niches for this technique.
Advantages • Inexpensive (~$10 USD ea.) • Price will drop • Small and Rugged – fit for tight spaces • Performance will improve! Thanks to Lighting Industry drive to develop greater efficiency and power • Custom Designs for higher operating temperatures and currents are possible. • Long life
Disadvantages • Some difficulty in coupling to optical fiber vs lasers • Cannot achieve high power in short bursts as lasers can and total energy output is less
Demonstrations of LED Excitation of High-Temperature Phosphors • LED Excitation of YAG:Dy Powder in High Temperature Oven (to 1100 °C) • Of YAG:Dy coating (ambient) • Of YSZ:Dy (ambient)
LED light directed into oven via Cu-clad fiber bundle Fiber bundle Optics Window/port Oven
Setup for Coating Fluorescence Measurements YAG:Dy • YAG:Dy Lens LED Detector (not shown) was close
Comparison of YAG:Dy and TBC Room temperature