Download
1 / 44
440 likes | 636 Vues
Review of Beam Instrumentation in CTF3. Anne Dabrowski CERN BE/BI On behalf of all involved. Outline. Overview of Instrumentation BPMs ; Transverse Profile ; Longitudinal Profile ; Bunch Frequency Measurements Instrumentation activity in 2009 New Installations Maintenance and improvements

E N D
Review of Beam Instrumentation in CTF3 Anne Dabrowski CERN BE/BI On behalf of all involved
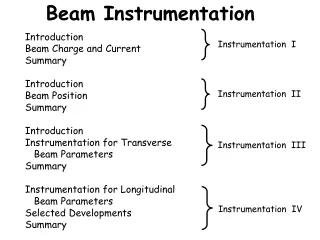
Outline • Overview of Instrumentation BPMs ; Transverse Profile ; Longitudinal Profile ; Bunch Frequency Measurements • Instrumentation activity in 2009 • New Installations • Maintenance and improvements • Calibrations and Beam Based Measurements • Instrumentation activity foreseen for 2010 • Design • New Installations • Upgrades
Overview of Instrumentation installed (I) Beam Position and Intensity Monitors 2 BPE’s + 46 BPM’s + 54 BPI’s + 6 Re-Cavity BPM (califes) + 16 BPS + 5 WCM’s • CTF3 has final 129 position / intensity monitors! • Main activities 2009 • Final BPM vacuum installations • Installation of 16 BPS with aligned support - Univ Valencia, Built and tested at IFIC. • BPS Amplifiers: Univ. Politècnica de Catalunya (UPC) • Radiation damage to LAPP digitizing acquisition for TL2 / CLEX installed in the machine • Preparation of “Linac / Combiner Ring type” acquisition system and calibration software for the BPMs in TL2 / CLEX Inductive Pickup (BPS) - TBL Juanjo Garrigós et al .Valencia Univ. (based on M. Gasior BPM, scaled for reduced aperture – 24 mm) 16 units resolution ~30um
Overview of Instrumentation Installed (II) Transverse Profile monitors 14 TV stations for OTR based emittance measurements 7 TV stations for OTR based spectrometry (energy) 7 TV stations for Synchrotron light (Chicane and Rings) DELAY LOOP COMBINERRING TL2 LINAC CLEX
Overview of Instrumentation Installed (III) • Longitudinal Bunch Profile • RF Deflecting Cavity, OTR • Streak Camera Synch Light, or OTR • Bunch Length Form Factor (r.m.s.) • BPR-W (Power @ 30 GHz) • RF-pickup (Power 30 – 170 GHz) • CDR Experiment • Bunch Combination Efficiency • BPR-S (Down-mixed 3 GHz) • Phase monitor DL • Phase monitor CR • Streak Camera Synch Light, or OTR Combine Beam, 12 GHz Bunch Spacing Stretching Chicane Compression chicane - TL2 Streak Labs DL, CR (now) CLEX (2010) • Linac ~ 1-7 ps • Delay Loop and Combiner Ring > 8ps • CLEX 1-2 ps • Probe Beam (Califes) < 2 ps σ= 4.5ps (1.4 mm) Cleaning Chicane σ= 8.9ps (2.7 mm) Injector, 1.5 GHz Bunch Spacing
Outline • Overview of Instrumentation BPMs ; Transverse Profile ; Longitudinal Profile ; Bunch Frequency Measurements • Instrumentation activity in 2009 • New Installations • Maintenance and improvements • Calibrations and Beam Based Measurements • Instrumentation activity foreseen for 2010 • Design • New Installations • Upgrades
Instrumentation activity in 2009 • New Installations • 7 Transverse Profile Monitors • TL2 emittance tank • TL2’ emittance tank • TBL emittance tank • TBTs drive beam (Uppsala / Saclay mechanics & planning – CERN acquisition & control) • TBTs probe beam (Uppsala / Saclay mechanics & planning – CERN acquisition & control) • TBL final spectrometer line • PHIN Virtual Cathode acquisition & control • PHIN • 2 Gated (5ns ; 100ns) Intensified Camera • 4.8 degrees to the spectral reflection for OTR based profile measurements • 20 Channel Segmented Dump for Time Resolved Profile Measurements designed, built and commissioned • Maintenance and Improvements • Replacement of damaged screens • Planning for “Linac / Combiner Ring type” BPM acquisition hardware TL2/CLEX • BPM Calibration software development for TL2/CLEX Activity 2009
Streak Camera – Bunch Length Measurement • Bunch Shape • A Skew Gaussian bunch shape • Measure calibration factors • Vary Time Streak Trigger and calculate the corresponding position of the peak of the bunch • 0.122 ± 0.004 ps/pixel (2 sigma) for 10ps/mm • Measurement of the jitter in peak • eg 5.5 ps ± 0.2 (2 sigma) • Contribution from trigger and beam • Slit size contribution to measurement • FWHM in focus 14.8±0.9 pixels (2 sigma) • Corresponds to ~350 μm Propagate all error contributions … Typical measurement error on FWHM is 4% (2 sigma) Activity 2009 – Beam Based Measurements
Bunch Length measurement along pulse train • Streak Camera in Combiner Ring using MTV 0496 (zero dispersion point) • 3 GHz uncombined beam, by-passing the delay loop • 50 ns sampling • 2 sigma error bars Use Streak Camera measurement and this bunch length variation to cross calibrate other bunch length instruments Activity 2009 – Beam Based Measurements
Relative Bunch Length measurement – BPRW • BPR with WR-28 waveguide port • Power measurement at (30±4) GHz 3 db band poss • For given beam current & position: • Maximise the signal Minimise bunch length
Calibration of CR.BPRW0505W with Streak Data • Data used: 04-12-2010 • Beam conditions: 3 GHz 4 Amp beam • Use time resolved bunch length from Streak • Assume quadratic function for fit Application of Calibration: • BPR and Streak in good agreement • Exercise should be repeated with different beams to study systematics and verify current and position normalization • Error in calibration large (40% error 2 sigma) • Measurement of BPM, BPR and Streak relevant for a good calibration • BPR’s used as Online bunch length measurement available today! Activity 2009 – Beam Based Measurements
Similarly Compare RF pickup (waveguide down mixing) to Streak Calibrated RF-pickup 33 GHz form factor Power measurement in time domain Correspond power (33 GHz) to bunch length Streak Corresponding Frequency domain Apply Band pass filter to isolate beam signal • Good agreement between RF pickup and Streak in the Steady state part of the pulse
Combination scheme even buckets • Delay Loop odd buckets • RF deflector Bunch Combination Efficiency Measurements Combiner Ring Multiplication λo =10cm • Bunch combination efficiency • Streak Camera using Synch Light • BPR (3 GHz Beam signal mixed with ref. 3 GHz signal) • Phase monitor • DL: Harmonics of 1.5 GHz and 3.0 GHz • CR: Harmonics of 3 GHz [6, 9 12, 15 GHz] λo =20cm Streak CCD Gated Injector, 1.5 GHz Bunch Spacing
Streak Camera measurements of 18th November 2009 Bunch spacing between Delay Loop and Combiner Ring:Measurement conditions: 50 ps/mm, blue filter in Example Aurélie Rabiller
Online monitoring bunch spacing with the Phase Monitor Power induced by the passing beam, picked up by 4 antennae Frequencies Delay loop: 7.5, 9.0, 10.5 & 12 GHz Combiner ring: 6.0, 9.0, 12.0 & 15 GHz Activity 2009 – Beam Based Measurements
Measuring the bunch spacing with Phase Monitor (CR) • Simulation • beam with uniform current • 15 ps FWHM Gaussian Bunch length uniform along the pulse • Turn 1, shows effect of bunch length Simulation 3 GHz + bunch length (t) + current (t) • Data compared to simulation • 3 GHz uncombined beam for hardware test (04-12-2010) • Raw signal corrected for electronic gains • Simulation includes the bunch length dependence along the pulse measured with the BPRW & current variation using BPM • Data compared to simulation, shows strong correlation Data 3 GHz Activity 2009 – Beam Based Measurements
Monitor bunch spacing with the Phase Monitor Measurement difficult to interpret because of bunch length and bunch spacing variations • Example of measurement 18 Nov 2009, Factor x8 combination current • DL ~ 20 ps late • Bunch length variation along the pulse train • The way forward? • Instrumentation: • Use BPRW in CT line to measure bunch length along pulse train & normalize • Produce feedback for the operators • Re-design phase monitor to work at lower frequencies – less sensitive to bunch length variations ?? (see extra slides for potential upgrade Steve Smith) Raw data CR Activity 2009 – Beam Based Measurements
Spectrometery Design work 2009 • Extensive Fluka and GEANT4 studies on 5-150 MeV electrons interacting with matter • Necessary for optimizing detector resolution, thermal effects, material choices and radiation damage for time resolved spectrometry • Transverse and longitudinal shower energy deposition Excellent FLUKA / GEANT4 agreement
Segmented dump for PHIN commissioned • Good correlation with Energy measured in the dump and RF • CTF3 note 099 • Tuning of the RF beam loading with segmented dump to get a uniform steady state beam pulse Beam loading compensation
Outline • Overview of Instrumentation BPMs ; Transverse Profile ; Longitudinal Profile ; Bunch Frequency Measurements • Instrumentation activity in 2009 • New Installations • Maintenance and improvements • Calibrations and Beam Based Measurements • Instrumentation activity foreseen for 2010 • Design • New Installations • Upgrades
Bunch Length Measurement in CLEX - 2010 • Bunch Length Measurement in CLEX Combine Beam, 12 GHz Bunch Spacing Stretching Chicane Compression chicane - TL2 Streak Labs DL, CR (now) CLEX (2010) • Design & Installation foreseen (2010) • Long Optical lines and New Streak Lab for Streak Camera measurement in CLEX • FESCA200 Streak Camera (300 fs resolution) arrive in July 2010 • 2 Streak Cameras aid beam studies in two machine locations at the same time • Non-destructive high frequency RF based bunch length monitoring measurement • Waveguides and diode components ordered (CTF3 & NWU) • Assembly & commissioning for 2010 Cleaning Chicane Acceleration 3.0 GHz Injector, 1.5 GHz Bunch Spacing Activity 2009-2010
Time resolved energy measurement TBL New detector design High intensity (28 A) e⁻ beam of 150 MeV ΔE ~10-60% High energy transient • Design: • 32 channel transverse faraday cup • 10° spectrometer line • includes full FLUKA simulation • realistic beam profile from PLACET • 3 mm segments, 400 μm slits collimator • Single shot measurement of the steady state • Implement in Machine TBL Fall 2010 Nominal pulse length: 140 ns 5% measurement on energy spread Activity 2009-2010
New BPM BI Calibration Software for TL2 and CLEX • Java user interface in development to perform the calibration for BPMs in TL2 and CLEX • Software: • Communicate to calibration controller crate • Calibration of all BPMs for 2 different gain ranges and attenuation ON/OFF settings • Save calibration coefficients to an archive file • Operators can load those calibration coefficients into database for use with the XenericSampler applications • Dedicated beam time for June startup needed for BPM calibration • Machine should be a “nominal” setting, with only the start beam trigger disabled, for calibration 132 devices with raw data: 44 pickups, 3 devices per each pickup: H/V plane + sigma
Beam Loss Monitor for TBL: a general layout β 400 x 400 SPAD array Cerenkov cone Active surface 1mm2 α Fibercore Recovery time ca. 4 ns electron Cerenkov photon 1 photon detection Physical principle BLM general layout CMOS technology Low cost detector Quantum efficiency 20% in blue range Immunity to external magnetic fields Silicon Photomultiplier Angela Intermite
Beam Loss Monitor for TBL: SiPM Dark Noise Characterization Dark count rate as a function of the overvoltage 1 MHz/mm2 @ 32V Dark count rate for different samples 1 pixel fired 3 pixels fired 2 pixels fired Goal: Identification of best sensor for detection of Cerenkov Light generated by particle losses. Investigation into: • Dark noise • Optical cross talk • Dynamic range of noise As a function of: • Overvoltage • Temperature • Number of pixels • Pixel arrangement • Optical trench between pixels Installation at CTF3 in 2010. Angela Intermite
Conclusion • A lot of BI activity in 2009 • All Vacuum installation for BPMs complete • All MTVs for transverse profile measurements installed • Full diagnostics spectrometer line for PHIN has been designed, installed commissioned • Robust Bunch Length Measurement with Streak Camera • Calibration of non-destructive RF bunch length measurements using Streak Results • BPR 30 GHz waveguide port • RF pickup • Measuring of the bunch spacing with the Steak and Phase monitor well mature • Systematic corrections due to bunch length variation & long bunches add additional complications to phase monitor measurement • Proposal to use 1.5 GHz down mixing technique (See extra slides Steve Smith) • New BPM calibration software for different gain / attenuation settings – for 2010 • “Linac /CR type” BPM electronics for CLEX will be ready for 2010 run • Design for time resolved spectrometry for TBL mature – ready for manufacturing • Design of bunch length measurement for CLEX has started • Long Optical lines to New Streak Camera Lab with new FESCA 200 Streak Camera • Non destructive RF based bunch length measurement techniques • Bunch spacing measurement for PHIN (phase coding) • BI will give support where possible (manpower/BI priorities) Activity 2010
Thank you for all you contributions & to the operators for the beams! Activity 2010
Position Monitors – CTF3 & R&D CLIC CTF3 Sept. 2009, Operation 2 BPE’s + 54 BPI’s + 46 BPM’s + 6 Re-Cavity BPM + 16 BPS + 5 WCM’s Reentrant Cavity BPM - Califes Inductive Pickup (BPS) - TBL Inductive Pickup - EuroTev BPM C. Simon, CEA Saclay 6 units Lars Soby et al. @ CERN 3 units Juanjo Garrigós et al .Valencia Univ. (based on M. Gasior BPM, scaled for reduced aperture – 24 mm) 16 units
Procedure Extracting the Bunch Length • Single bunch profile – Skew Gaussian • Extract FWHM from measured parameters • Error of FWHM (in pixels) given by: • Calibrate and subtract quadratically contributions from jitter and PSF Peak = µ where: Propagate all error contributions … Typical measurement error on FWHM is 4% (2 sigma) Activity 2009 – Beam Based Measurements
BPM TL / CLEX Acquisition system Lars Soby Activity 2010
New BPM Calibration Software for TL2 and CLEX • New BPM acquisition Software with Java user interface in development • Compliments the exisiting sampler software used by CTF3 OP • Software will • Communicate to calibration controller crate • Calibration of all BPMs for 2 different gain ranges and attenuation ON/OFF settings • Save calibration coefficients to a database log • Setup a gain and attenuator. 2 devices, one per rack. FECs: • cfv-2010-actfrfmt • cfv-2010-bpmtl2tbts According to the given settings, uploading operational calibration coefficients to 396 devices linked to pickups and to 6 devices of a WCM Activity 2010
Measurement of the Phase Coding in PHIN • Phase coding for the PHIN laser will be implemented & tested late 2010/2011 • Phase coding of the Laser verified with the Streak Camera • BI/PM will provide support (depending on other priorities) • Design optical line with only a small fraction of laser photons • Measurement phase switch on the electron beam to be designed • Proposal • Generate Cherenkov photons with a sapphire Chrystal • Hardware exists from CTF2 –compatibility with PHIN beam parameters (beam size, bunch charge) to be checked • Build an optical line to transport photons from PHIN to the laser room • Image these photons with the Streak Camera • BI/PM will provide support (depending on other priorities) Activity 2010
Proposal for phase monitor for the DL based on 1.5 GHz signal (S. Smith) • To remove the bunch length dependency from phase measurement propose a phase measurement based on a lower frequency • For DL Loop 1.5 GHz rate in 3.0 GHz rate out • Ideal output is periodic at 3.0 GHz • Path length error yields signal periodic at 1.5 GHz • gives rise to 1.5 GHz component in signal • So does slow intensity modulation in input beam • For the DL, S. Smith proposes to use a reference 1.5 GHz signal, and to downmix it with the beam signal hence measuring directly any residual 1.5 GHz beam component that indicate a poor combination after the Delay Loop • Simulations show sensitivity to < 1ps shown in his simulations • Much of the BPR-S pickup and electronics can be reused, only e need an (unlocked) RF source for the 1.425 MHz LO signal needed and 1.5 GHz mixer • Block Schema – see extra slides • For measuring the bunch combination efficiency in the combiner ring, no simple schema available • Needs more work to find a bunch length independent schema Steve Smith Activity 2010
Simulation of 1.5 GHz down-mixing phase monitor • Simulate ±1ps delay loop timing error. • Modulated at 25 MHz to make it stand out in the simulation, • Add ±10% charge variation in alternating (3 GHz) buckets. • modulated at 10 MHz (for visibility) • expect errors quasi-static in real machine • The simulated LO is phased to make the timing error show up as (almost) purely real. • find a scale of 10 mV/ps timing error. • demodulate the 1.5 GHz to: • real component (timing error) • imaginary component (amplitude mis-match) • The amplitude of the 1.5 GHz signal is completely dominated by the amplitude mis-match signal • one can still cleanly extract the timing error signal. • The timing error signal contaminated ~0.5ps level by the charge variation Steve Smith
Systematic: 1.5 GHz phase monitor Steve Smith • Resolution is not limited by the signal strength • but by systematic like charge variation present on drive beam. • Expect that to get the timing correct to 1 degree of 3 GHz (1ps) one needs the current the same to 1% over the delay of the delay loop • However at 1.5 GHz this signal is in quadrature to the timing error signal • can in principle be separated. • The charge difference signal is in phase with the 1.5 GHz bunches, where the time error signal is 90 degrees out of phase, • that is it comes from the alternating short and long gaps between bunches and is phased with the center of the short gap. • Guess: reduces sensitivity to charge variation by x100 • Could probably tolerate 10% charge variation over the train and still measure delay loop timing errors of <1 ps.
Path-Lenth Diagnostics Conclusion Steve Smith Looks straightforward to measure timing to <1ps. Most of the hardware already exists. We need a mixer, a couple of filters and possibly an amplifier or two and probably a couple of pads. We need an (unlocked) RF source for the 1.425 MHz LO. And software!
Extension of same principle to RF-pickup Measurement principle: • Measure the amplitude of the beam harmonic (30-172 GHz) of interest • The correlation between amplitude and bunch length depends on the bunch shape • Normalize the power to changes in the charge and the position squared in the cavity Example for Talk: • 33 GHz beam harmonic (since bunches rather long during calibration) • ADC is 2 GS/s, typically use 4000 points, 2 micro second time window, delta t = 0.5 ns (X10 faster than BPRW sampling) • LO can be chosen to have an IF that gives the best sampling of the bunch length variation along the pulse Activity 2009 – Beam Based Measurements
Implement band-pass filtering in the time domain Apply Band pass filter to isolate beam signal Corresponding Frequency domain Power measurement in time domain |power| [au] Calibrated RF-pickup 33 GHz form factor Calibrate the Streak form factor vs. RF pickup power measurement Use linear function pfg(x) = a*x+b a = 0.04571 (0.03752, 0.05389) b = 0.1536 (0.104, 0.2032) Good agreement between RF pickup and Streak
Energy gain and Bunch Lengthening • Due to the pulse compression system, phase sag along the Klystron pulse ~ 5-15° (see talk of A. Dubrovskiy) • not all bunches see same RF phase • Difference energy gain of one bunch with respect to another • Within a single bunch, the head and tail of bunches to have different energy Example of RF amplitude and phase for MKS03 Blue 30 GHz power signal before injector chicane Green 30 GHz power signal after injector chicane • Bunch length variation along the pulse train is a feature in CTF3 (to a greater / lesser extent depending on RF) • Time resolved bunch length diagnostics essential
OTR screens for PHIN spectrometer optimised Maylar screen • Surface current on Aluminized mylar screen imaged • CTF3 note 099 Replaced by Al foil works well PHIN camera at 4.8 deg to vertical for optimal light acceptance Al screen works better
Time resolved energy measurement TBL • Installed single slit segmented dump (2009) • Slit dump already used to understand TBL • slit 1mm wide • Length 100 mm • iron First measurement at TBL (November 2009) Activity 2009-2010
Instrumentation activity in 2009 • New Installations • 7 Transverse Profile Monitors • CC.MTV0532 – TL2 emittance tank • CC.MTV0970 - TL2’ emittance tank • CB.MTV1070 – TBL emittance tank • CBS.MTV0100 – TBL spectrometer line • CM.MTV0590 – TBTs drive beam side (Uppsala / Saclay mechanics & planning – CERN acquisition & control) • CA.MTV0790 – TBTs probe beam side (Uppsala / Saclay mechanics & planning – CERN acquisition & control) • CF.MTV0100 – PHIN Virtual Cathode • PHIN • 2 Gated (5ns ; 100ns) Intensified Camera • 4.8 degrees to the spectral reflection for OTR based profile measurements • 20 Channel Segmented Dump for Time Resolved Profile Measurements designed, built and commissioned • Maintenance and Improvements • Replacement of damaged screens • Planning for an Linac / Combiner ring type BPM acquisition hardware & calibration software for CLEX Activity 2009