Bayesian Learning: Understanding 'Good' Subset of Data
Dive into Bayesian learning to distinguish 'good' compounds from baseline, leveraging molecular properties and ECFP fingerprints for efficient and robust classification without tuning parameters. Engage with learning models to assess and prioritize compounds effectively, maximizing screening outcomes.

Bayesian Learning: Understanding 'Good' Subset of Data
E N D
Presentation Transcript
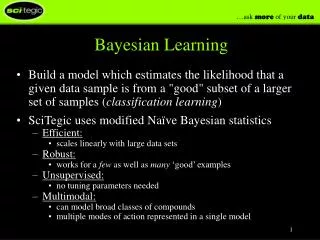
Bayesian Learning • Build a model which estimates the likelihood that a given data sample is from a "good" subset of a larger set of samples (classification learning) • SciTegic uses modified Naïve Bayesian statistics • Efficient: • scales linearly with large data sets • Robust: • works for a few as well as many ‘good’ examples • Unsupervised: • no tuning parameters needed • Multimodal: • can model broad classes of compounds • multiple modes of action represented in a single model
N O A A Learn Good from Bad • “Learn Good from Bad” examines what distinguishes “good” from “baseline” compounds • Molecular properties (molecular weight, alogp, etc) • Molecular fingerprints “Good” Baseline
Learning: “Learn Good From Bad” • User provides name for new component and a “Test for good”, e.g.: • Activity > 0.5 • Conclusion EQ ‘CA’ • User specifies properties • Typical: fingerprints, alogp, donors/acceptors, number of rotatable bonds, etc. • Model is new component • Component calculates a number • The larger the number, the more likely a sample is “good”
Using the model • Model can be used to prioritize samples for screening, or search vendor libraries for new candidates for testing • Quality of model can be evaluated: • Split data into training and test sets • Build model using training set • Sort test set using model value • Plot how rapidly hits are found in sorted list
Using a Learned Model • Model appears on your tab in LearnedProperties • Drag it into a protocol to use it “by value” • Refer to it by name to use it “by reference”
ECFP: Extended Connectivity Fingerprints • New class of fingerprints for molecular characterization • Each bit represents the presence of a structural (not substructural) feature • 4 Billion different bits • Multiple levels of abstraction contained in single FP • Different starting atom codes lead to different fingerprints (ECFP, FCFP, ...) • Typical molecule generates 100s - 1000s of bits • Typical library generates 100K - 10M different bits.
Advantages • Fast to calculate • Represents much larger number of features • Features not "pre-selected" • Represents tertiary/quaternary information • Opposed to path based fp’s • Bits can be “interpreted”
ECFP: Generating the Fingerprint • Iteration is repeated desired number of times • Each iteration extends the diameter by two bonds • Codes from all iterations are collected • Duplicate bits may be removed
ECFP: Extending the Initial Atom Codes • Fingerprint bits indicate presence and absence of certain structural features • Fingerprints do not depend on a predefined set of substructural features A A A Iteration 0 N A O A A A Iteration 1 Each iteration adds bits that represent larger and N larger structures O A A Iteration 2
The Statistics Table: Features • A feature is a binary attribute of a data record • For molecules, it may be derived from a property range or a fingerprint bit • A molecule typically contains a few hundred features • A count of each feature is kept: • Over all the samples • Over all samples that pass the test for good • The Normalized Probability is log(Laplacian-corrected probability) • The normalized probabilities are summed over all features to give the relative score.
Normalized Probability • Given a set of N samples • Given that some subset A of them are good (‘active’) • Then we estimate for a new compound: P(good) ~ A / N • Given a set of binary features Fi • For a given feature F: • It appears in NF samples • It appears in AF good samples • Can we estimate: P(good | F) ~ AF / NF • (Problem: Error gets worse as NF small)
Quiz Time • Have an HTS screen with 1% actives • Have two new samples X and Y to test • For each sample, we are given the results from one feature (FX and FY) • Which one is most likely to be active?
Question 1 • Sample X: • AFx: 0 • NFx: 100 • Sample Y: • AFy: 100 • NFy: 100
Question 2 • Sample X: • AFx: 0 • NFx: 100 • Sample Y: • AFy: 1 • NFy: 100
Question 3 • Sample X: • AFx: 0 • NFx: 100 • Sample Y: • AFy: 0 • NFy: 0
Question 4 • Sample X: • AFx: 2 • NFx: 100 • Sample Y: • AFy: 0 • NFy: 0
Question 5 • Sample X: • AFx: 2 • NFx: 4 • Sample Y: • AFy: 200 • NFy: 400
Question 6 • Sample X: • AFx: 0 • NFx: 100 • Sample Y: • AFy: 0 • NFy: 1,000,000
Normalized Probability • Thought experiment: • What is the probability of a feature which we have seen in NO samples? (i.e., a novel feature) • Hint: assume most features have no connection to the reason for “goodness”…
Normalized Probability • Thought experiment: • What is the probability of a feature which we have seen in NO samples? (i.e., a novel feature) • The best guess would be P(good) • Conclusion: • Want estimator P(good | F) P(good) as NF small • Add some “virtual” samples (with prob P(good)) to every bin
Normalized Probability Our new estimate (after adding K virtual samples) • P’(good | F) = (AF + P(good)K) / (NF + K) • P’(good | F) P(good) as NF 0 • P’(good | F) AF / NF as NF large • (If K = 1/P(good) this is the Laplacian correction) • K is the duplication factor in our data
Normalized Probability • Final issue: How do I combine multiple features? • Assumption: number of features doesn’t matter • Want to limit contribution from random features • P’’’(good | F) = ((AF + P(good)K) / (NF + K)) / P(good) • Pfinal = P’’’(good|F1) * P’’’(good|F2) * … • Phew! • (The good news: for most real-world data, default value of K is quite satisfactory…)
Generating Enrichment Plots • “If I prioritized my testing using this model, how well would I do?” • Graph shows % actives (“good”) found vs % tested • Use it on a test dataset: • That was not part of the training data • That you already have results for
Modeling Known Activity Classes from the World Drug Index • Training set25,000 random selected compounds from WDI • Test set25,000 remaining cmpds from WDI + 25,000 cmpds from Maybridge • Descriptorsfingerprints, ALogP, molecular properties • Build models for each activity class: progestogen, estrogen, etc WDI 50K 25K 25K Maybridge 25K Training set Test set
Enrichment Plots • Apply activity model to compounds in test set • Order compounds from ‘best’ to ‘worst’ • Plot cumulative distribution of known actives • Do this for each activity class actives
Choosing a Cutoff Value • Models are relative predictors • Suggest which to test first • Not a classifier (threshold independent) • To make it a classifier, need to choose a cutoff • Balance between • sensitivity (True Positiverate) • specificity (1 - False Positive rate) • Requires human judgment • Two useful views • Histogram plots • ROC (Receiver Operating Characteristic) plots
Choosing a Cutoff Value: Histograms • A histogram can visually show the separation of actives and nonactives using a model
Choosing a Cutoff Value: ROC Plots • Derived from clinical medicine • Shows balance of costs of missing a true positive versus falsely accepting a negative • Area under the curve is a measure of quality : • - .90-1 = excellent (A) • - .80-.90 = good (B) • - .70-.80 = fair (C) • - .60-.70 = poor (D) • - .50-.60 = fail (F)
Postscript: non-FP Descriptors • AlogP • A measure of the octanol/water partition coefficient • High value means molecule "prefers" to be in octanol rather than water – i.e., is nonpolar • A real number • Molecular Weight • Total mass of all of the atoms making up the molecule • Units are atomic mass units (a.m.u.) in which the mass of each proton or neutron is approximately 1 • A positive real number
Postscript: non-FP Descriptors • Num H Acceptors, Num H Donors • Molecules may link to each other via hydrogen bonds • H-bonds are weaker than true chemical bonds • H-bonds play a role in drug activity • H donors are polar atoms such as N and O with an attached H (can "donate" a hydrogen to form H-bond) • H acceptors are polar atoms lacking an attached H (can "accept" a hydrogen to form H-bond) • Num H Acceptors, Num H Donors are counts of atoms meeting the above criteria • Non-negative integers
Postscript: non-FP Descriptors • Num Rotatable Bonds • Certain bonds between atoms are rigid • Bonds within rings • Double and triple bonds • Others are rotatable • Attached parts of molecule can freely pivot around bond • Num Rotable Bonds is count of rotatable bonds in molecule • A non-negative integer