Recent BTH West Vibration Study for LCLS-II
300 likes | 489 Vues
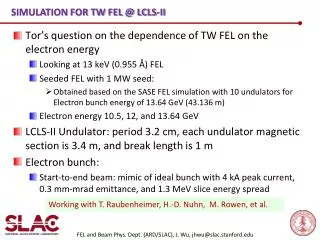
Recent BTH West Vibration Study for LCLS-II. James L. Turner and Alev Ibrahimov February 07, 2012. Vibration Issues. Undesired electron beam motion can come from Quadrupole motion.

Recent BTH West Vibration Study for LCLS-II
E N D
Presentation Transcript
Recent BTH West Vibration Study for LCLS-II James L. Turner and Alev IbrahimovFebruary 07, 2012
Vibration Issues • Undesired electron beam motion can come from Quadrupole motion. • Quadrupoles in the main Linac – OK in vertical with clamps from SLC era. Horizontal fix done for LCLS-I through AIP. • Quadrupoles in the LTU – Both planes better than specified in LCLS-I vibration budget.
Vibration Documents Quadrupole Vibration PRD
LTU Quadrupole Vibration Before installation, tests were done with one completed assembly of each type (engineering note EN-ESC-000-001). The destination site (BTH) floor was measured with no conventional facilities installed After installation, all were measured in situ and bolt torques needed to be revisited to get them to design torque. All LTU quadrupole vibration with facilities on were better than specified type (engineering note EN-ESC-000-003).
LTU QDL33 Vertical On top of quad 4-100Hz 7nm Top plot is power spectral density from 4-100 Hz Bottom integrated psd.
LTU QDL33 on top measurement Horizontal impulse Damping time <1s fundamental at ~35Hz.
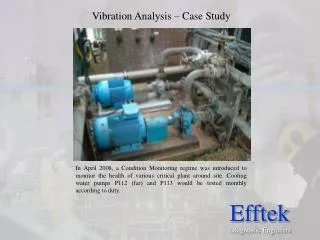
Measurement System • The vibration measurement system consisted of Sercel geophones (horizontal and vertical), a National Instruments interface system comprised of an NI SCC-68 68-pin terminal block with SCC expansion slots, 2 SCC-ACC01 1 channel accelerometer input modules, SHC68-68-EP Shielded cable 2 meter, and DAQ Card-6036E Multifunction DAQ plugged into a Dell Latitude laptop running MATLAB with the “Data Acquisition Toolbox”. • The system had been cross-calibrated with another SLAC system using LABVIEW (thanks to Andrei Seryi), and up to 40Hz with a laser tracker thanks to Mark Petree and Georg Gassner.
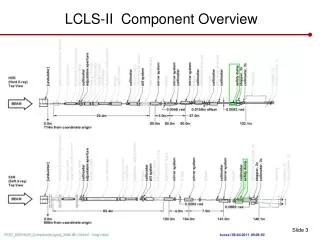
This section from MUON shield is not visible. It’s covered now This is end of MUON shield and LTU beginning Some reference points This is the line where the covered MUON section begins
Some reference points Measurement points: at 67 feet, 167 feet, and 286 feet from beginning of BTH
About the Measurements... • Measurements were made of the horizontal N/S, horizontal E/W, and vertical spectrum on the top of the BTH West. Data are plotted and integrated between 4 and 100 Hertz. There is instrument fall-off above 40 Hertz not taken into account, so numbers derived from data above 40 Hertz are underestimated.
The Instruments • Channel 1 in all cases is vertical, channel 2 is horizontal north/south, and channel 3 is horizontal east/west along the beam travel axis. Channel 4 is a piezo-base accelerometer oriented to supplement the vertical geophone.
Measurement locations • Measurements in center of blocks and on the south “rail” atop the south wall.
Measurement locations • Midway and at the east end near the headhouse
Time Series • Time series to identify data sets perturbed by impulses from workers somewhat nearby. 2 minute sets had least perturbations.
Vertical PSD Mid-Block at 67’ • Mid Block power spectral density and integrated PSD plots from 4-100Hz
Vertical PSD on South Wall at 67’ • South rail power spectral density and integrated PSD plots from 4-100Hz
Vertical PSD Mid-Block at 167’ • Mid Block power spectral density and integrated PSD plots from 4-100Hz
Vertical PSD Mid-Block at 167’ • Mid Block power spectral density and integrated PSD plots from 10-100Hz from Accelerometer.
Vertical PSD on South Wall at 167’ • South rail power spectral density and integrated PSD plots from 4-100Hz
Vertical PSD Mid-Block at 286’ • Mid Block power spectral density and integrated PSD plots from 4-100Hz
Vertical PSD on South Wall at 286’ • South rail power spectral density and integrated PSD plots from 4-100Hz
Horizontal PSD Mid-Block at 67’ • Mid Block power spectral density and integrated PSD plots from 4-100Hz
Horizontal PSD South Wall at 67’ • South Wall power spectral density and integrated PSD plots from 4-100Hz
Horizontal PSD Mid-Block at 167’ • Mid Block power spectral density and integrated PSD plots from 4-100Hz
Horizontal PSD South Wall at 167’ • South Wall power spectral density and integrated PSD plots from 4-100Hz
Horizontal PSD Mid-Block at 286’ • Mid Block power spectral density and integrated PSD plots from 4-100Hz
Horizontal PSD South Wall at 286’ • South Wall power spectral density and integrated PSD plots from 4-100Hz
Summary Vibration budget needs tobe different that LCLS-I.
Linac LI22 Q801 Horizontal Motion Quadrupole LI22 801 from 4-100 Hertz. Without this fix, you may have up to a micron in the horizontal in the Linac.