Analysis of Cold Front Dynamics on May 24, 2002 Using W-band Radar Observations
200 likes | 337 Vues
This study provides a detailed examination of the synoptic situation at 18 UTC on May 24, 2002, focusing on the cold front dynamics and associated meteorological phenomena. Utilizing airborne W-band radar data and operational surface observations, the research highlights the evolution of the cold front, mixing ratios, temperature profiles, and reflectivity patterns. The insights gained from the WCR's transects reveal kinematic aspects of the cold front that have previously been simulated but not observed in real-time, enhancing our understanding of cold frontal processes.

Analysis of Cold Front Dynamics on May 24, 2002 Using W-band Radar Observations
E N D
Presentation Transcript
The May 24 Shamrock cold front A King Air/ WCR close-up view Bart Geerts & Dave Leon University of Wyoming
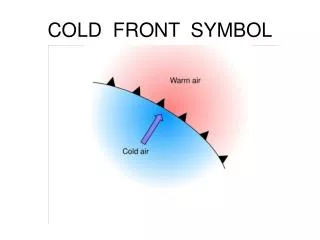
Synoptic situation at 18 UTC on 24 May 2002, based on the ETA initialization. Equivalent potential temperature (color field) and winds (blue, a full barb equals 10 kts) at 900 mb, sea level pressure (yellow contours), and 300 mb geopotential height (red contours).
21 Z 18 Z 8 dropsondes, 20:22 - 20:57 Z GOES 8 visible satellite image, operational surface observations, and subjective frontal analysis
mixing ratio q pressure (mb) cold front east west total distance: 217 km
TX OK cold front dryline radial velocity reflectivity 19:00 Z Td=9°C r = 7.4 g/kg Smart-R and mobile mesonet data
19:30 Z Td=15°C r =11.4 g/kg
19:42 UTC AMA 19:52 UWKA N 19:43 cold front dryline WCR up-looking, flight level 165 m
WCR vertical velocities dryline cold front
Triple point transect 20:12 Flight level: ~2300 m AGL King Air cold front @20:09 20:07 frontal motion SSE 164 NNW 344 front & dryline moist air cold air
Flight level: 2300 m AGL WCR nadir antenna reflectivity frontal motion dBZ
reflectivity 1:1 aspect ratio
Height above flight level (m) total length: 11.2 km aspect ratio: 1:1 NW 315 flight level: 360 m AGL frontal motion SE 135 19:33 - 19:35:33 possibly stratus clouds frontal motion WNW 344 ESE 164 km 20:21:50 - 20:25:40 km -5 NNW 344 SSE 164 2.0 1.5 1.0 0.5 8 6 dBZ -45 20:27:00 - 20:30:48 km NW 300 SE 120 20:42:43 - 20:46:18
21:06:36-21:13:20 Gravity waves in the cold-frontal stratus frontal motion This is a cloud whose towering tops had grown well above 4 km AGL, part of a line of storm cells aligned with the cold front mixing ratio 9 km Deep convection develops 9 km ahead of sfc cold front w 21:05 21:15 wind direction 21:32 q qe WNW 290 ESE 110
summary • An airborne W-band radar sampling at 30 Hz & a resolution of ~25 m can measure echoes in the opticaly-clear warm-season CBL. • Dual-Doppler synthesis at close range is feasible. • The WCR echo and velocity transects confirming kinematic aspects of a cold front that have been simulated in the lab and by hi-res numerical models, but have never been observed before.