Download
1 / 20
200 likes | 325 Vues
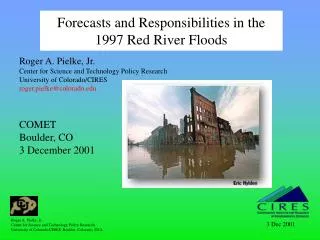
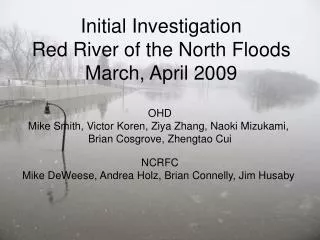
Initial Investigation Red River of the North Floods March, April 2009. OHD Mike Smith, Victor Koren, Ziya Zhang, Naoki Mizukami, Brian Cosgrove, Zhengtao Cui. NCRFC Mike DeWeese, Andrea Holz, Brian Connelly, Jim Husaby. Observed Stage at Fargo, ND. Top of Levee 41.0 ft. 3/28/2009

E N D
Initial InvestigationRed River of the North FloodsMarch, April 2009 OHD Mike Smith, Victor Koren, Ziya Zhang, Naoki Mizukami, Brian Cosgrove, Zhengtao Cui NCRFC Mike DeWeese, Andrea Holz, Brian Connelly, Jim Husaby
Observed Stage at Fargo, ND Top of Levee 41.0 ft 3/28/2009 40.82 ft 4/16/2009 33.98 ft Flood Stage 18.0 ft
NCRFC: “Where did the water go?” Observed and Forecast Stages Red River at Fargo, ND. This forecast verified well but dropped out early NCRFC most concerned about the over-prediction of the second crest ‘typical NCRFC forecast’ Stage Observed stage Water stored on surface or in frozen soil? April 16 March 28
NCRFC: “Where did the water go?” Hypothesis • Sudden rise in air temperatures combined with rain March 20-24 melted the (record) snow pack, leading to major flooding. • Some melt water ponded on the flat terrain, possibly blocked by frozen culverts • Sudden severe drop in air temperature March 25 froze the ponded surface water • As the frozen soil and ponded water thawed out: • the ponded water infiltrated into the soil • did not immediately appear in observed 2nd crest • came out as baseflow (Mike DeWeese said it was a very long recession, if not a record).
Hypothesis Testing • Meteorological and field observations • Soil temperature (HPRCC) • Air temperature (HPRCC) • Experiments with SAC-HT and ponded water • Water balance simulations
Ekre Fargo Sabin Lisbon Fingal Leonard Wahpeton Wyndmere Wild Rice River Oakes Britton Stations from the High Plains Regional Climate Center 1. Meteorological and Field Observations
Meteorological • and Field Observations Observed Air and Soil Temperature March and April 2009 Sudden warm up, snow pack melts; then sudden refreezing Red at Fargo Stage 40 30 Stage at Fargo, ft. 20 Air temp very cold, soil temp not affected 10 April March Air temp very cold, soil temp affected Indicates soil possibly covered by water
2. Experiments with SAC-HT and Ponded Water • Use point temperature data at Wahpeton, ND • Run SAC-HT with three depths of ponded water at a point in hypothetical experiment. • Note effects on soil temperature • Note effects on frozen ground and percolation
Water on the Soil Surface in SAC-HT 2. Experiments with SAC-HT and Ponded Water Layer 0 Water on the surface Layer 1 Layer 2 Soil column Layer 3 Layer 0 does not affect the water supply to SAC-HT but changes the atmosphere-soil heat exchange, and as a result the soil freezing process Layer 0 is normally at 0.58 porosity. ‘Fill’ this porosity with 3 levels of water: 2.6, 11.6, and 12.2 mm of water
2. Experiments with SAC-HT and Ponded Water Red River Soil Freezing Analysis Discharge at Wahpeton USGS Gauge September, 2008 to June, 2009 Discharge, cfs Month Air temperature and soil temperature for 3 depths of ponded water Temperature, C Month
2. Experiments with SAC-HT and Ponded Water Red River Soil Freezing Analysis Sudden Warm-up Ice in Layer 0 Wahpeton, ND. Ice Content, mm Month Upper Zone Saturation, % Wahpeton, ND. Month
2. Experiments with SAC-HT and Ponded Water Red River Soil Freezing Analysis: Second Crest Wahpeton Flow, cfs March - April Wahpeton, ND. Rain/melt, mm March - April Wahpeton, ND. Temperature, C March - April
2. Experiments with SAC-HT and Ponded Water Red River Soil Freezing Analysis: Second Crest Wahpeton, ND. Wahpeton Flow, cfs March - April Wahpeton, ND. Upper zone saturation, % March - April March - April Wahpeton, ND. Ice Content, mm
2. Experiments with SAC-HT and Ponded Water Red River Soil Freezing Analysis: Second Crest Percolation Wahpeton, ND Case of 12.2 mm of ponded water The deeper the water/ice on surface, the more the soil remains thawed and therefore percolates more water: Very sensitive Percolation, mm/hr March - April Wahpeton, ND Total Runoff Total Runoff, mm/hr Less runoff with deeper layer of surface water March - April Wahpeton, ND Surface Runoff Surface Runoff, mm/hr March - April
2. Experiments with SAC-HT and Ponded Water Preliminary Conclusions • Soil temperatures dependent on surface water/ice • Frozen water in the soil can have a large impact on percolation • SAC-HT runs indicate that surface water could have percolated into the soil rather than running off into the channel
Next Steps with Soil Freezing Analysis • Modify SAC-HT to input amount of surface water; currently hard coded. • Run analyses over basins not just point
3. Water Balance Simulations • NCRFC recommended using Wild Rice River at Abercrombie, ND to illustrate problems • Major tributary to Red River above Fargo • Record flooding during event • Method for initial analysis: • Extract RFC operational MAP, MAT time series for period October 1, 2008 to June 1, 2009 (done) • Run existing (no SAC-HT) RFC segments over period Oct. 1, 2008 to June 1, 2009; confirm that we’re getting same results as NCRFC (ongoing) • Note behavior of simulated snow pack and runoff. • Perform detailed water balance computations using NWSRFS WATERBAL operation; compute: • Total precipitation: rain and snowfall • Total evapotranspiration • Change in storage • Total runoff • Re-run with SAC-HT • Extend analyses to other basins above Fargo, ND.
Fargo Wild Rice River Above Abercrombie, ND Abercrombie
Finding • Existing SAC-HT can be run now as a diagnostic tool to indicate frozen/ponded water at surface (must start further back in time to catch the dynamics)
Acknowledgements We would like to thank Natalie Umphlett of the HPRCC for graciously providing access to their data