Download
1 / 48
490 likes | 621 Vues
Clemens Rössler Thomas Ihn Klaus Ensslin C. Reichl W. Wegscheider. Aleksey Kozikov. Imaging transmission of nanostructures in a high-mobility heterostructure. Local electron transport. Classical/quantum phenomena. Diffusive/ballistic transport. Motivation. Ultra high-mobility:

E N D
Clemens Rössler Thomas Ihn Klaus Ensslin C. Reichl W. Wegscheider Aleksey Kozikov Imaging transmission of nanostructures in a high-mobility heterostructure Local electron transport • Classical/quantum • phenomena • Diffusive/ballistic • transport
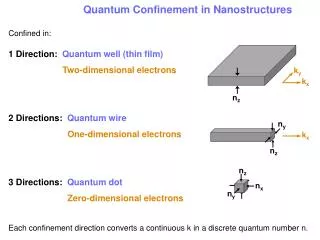
Motivation • Ultra high-mobility: • lp >> L Ballistic transport: • electron trajectories are straight lines • Modulation doping technique Small-angle scattering: • electron trajectories are wavy lines • How does small-angle scattering affect transport?
Motivation Conductance, G 2DEG QPC y x M. Topinkaet al.Nature 410, 183-186 (2001)
Motivation Scannellet al.PRB 85, 195319 (2012) K 115 K 0.24 K Local relocation of charge between donor sites
Motivation Conductance through a tunneling diode Wilkinson et al. Nature 380, 608 (1996)
Motivation Experimental data Filtered data Crook et al. PRL 91, 246803 (2003)
Motivation Experimental data Filtered data Theory Aoki et al. PRL 108, 136804 (2012) No one-to-one correspondence
Sample Golden top gates n = 1.2 × 10¹⁵ m-2 EF = 4 meV λF = 72 nm µ = 850 m2/Vs lp = 49 µm DStadium = 3 µm 1 µm 2DEG Ballistic stadium QPC Excellent wafers: C. Reichl W. Wegscheider ETH Zurich
Quantum point contact Top gates Electron flow D. A. Wharamet al., 1988 B. J. van Weeset al., 1988 2DEG
SGM technique Energy Tip Top gates d D. A. Wharamet al., 1988 B. J. van Weeset al., 1988 Landauer-Büttiker theory of transport 2DEG Backscattering effect
Electron backscattering through the QPC Differential conductance, dG/dx x y 3rd plateau Vtip= -6.0 V d = 70 nm arXiv:1206.1371 1 µm
Scanning gate microscopy on a QPC 0.5 µm y (µm) • Gate voltage dependence • Tip voltage dependence • Tip-surface distance dependence • Temperature dependence • Source-drain bias dependence • QPC asymmetry dependence • Magnetic field dependence: backscattering is essential • Strongly varying interference fringe spacing (50%) X (µm) Small-angle scattering arXiv:1206.1371
Scanning gate microscopy on a stadium dG/dx 1 µm Vtip= -8.0 V y (µm) Vstadium= -0.5 V X (µm)
Scanning gate microscopy on a stadium dG/dx 1 µm Vtip= -8.0 V y (µm) Vstadium= -0.8 V X (µm)
Scanning gate microscopy on a stadium dG/dx 1 µm Vtip= -8.0 V y (µm) Vstadium= -2.0 V X (µm)
Scanning gate microscopy on a stadium dG/dx G (2e2/h) 1 µm 1 µm Vtip= -8.0 V Vstadium= -0.8 V
Scanning gate microscopy on a stadium dG/dx 500 nm
Scanning gate microscopy on a stadium dG/dx G (2e2/h) dG/dx
Qualitative model d a c b
Qualitative model d a c Rcr contact resistance b
Qualitative model G (2e2/h) Assumptions: Rcr= 0, d = ∞ c = 25, W = 0.9 µm, RTip=0.5 µm
Model vs. experiment Model G (2e2/h) Experiment G (2e2/h) µ Dashed lines are guides to the eye
Model vs. experiment 1D profiles along red lines shown in the previous slide
Magnetic field dependence dG/dx 1 µm y (µm) Vtip= -8.0 V Vcgate= -1.0 V B = 0 mT X (µm)
Magnetic field dependence dG/dx 1 µm y (µm) Vtip= -8.0 V Vcgate= -1.0 V B = 50 mT X (µm)
Magnetic field dependence dG/dx 1 µm y (µm) Vtip= -8.0 V Vcgate= -1.0 V B = 100 mT X (µm)
Magnetic field dependence dG/dx 1 µm y (µm) Vtip= -8.0 V Vcgate= -1.0 V B = 200 mT X (µm)
Magnetic field dependence dG/dx 1 µm y (µm) Vtip= -8.0 V Vcgate= -1.0 V B = 300 mT X (µm)
Magnetic field dependence dG/dx 1 µm y (µm) Vtip= -8.0 V Vcgate= -1.0 V B = 500 mT X (µm)
Magnetic field dependence dG/dx 1 µm y (µm) Vtip= -8.0 V Vcgate= -1.0 V B = 0 mT X (µm)
Magnetic field dependence dG/dx dG/dx QPCSGM116 5thcooldown Dr.DietmarWeinmann, Strasbourg, France
Summary (experimental observations) 500 nm 1 µm • QPC: • Backscattering effect • Interference effect 1 µm • Ballistic stadium: • Two fringe patterns • Conductance fluctuations
Summary (experimental features not covered by the model) • Center of the stadium • Positions of the lens-shaped regions • Magnetic field • dependence
Numerical simulations (top panel) vs. experiment (bottom panel) RTip=1 µm RTip=0.5 µm RTip=0.05 µm Vtip = - 6 V Vtip = - 8 V Vtip = - 4 V G ≈ 17× 2e2/h without the tip
Features not explained by simulations • A region of reduced conductance in the center of the stadium at low tip biases (experiment) • Positions of the lens-shaped regions: • inside the stadium in the experiment • in the centers of the constrictions in the simulations
Numerical simulations (B = 0 mT):same as in the previous slide, but the color scales are different RTip=0.05 µm RTip=0.5 µm RTip=1 µm
SGM technique Tip Energy μS μD Top gates Tip-induced potential D. A. Wharam et al., 1988 B. J. van Wees et al., 1988 2DEG Gating effect
Scanning inside the stadium Vtip=-8.0 V Vcgate=-1.0 V VQPC=0 V
Scanning inside the stadium Vtip=-8.0 V Vcgate=-1.0 V VQPC=-0.38 V B=0 mT
Profiles A B Vtip=-8.0 V Vcgate=-1.0 V B=0 mT Left QPC is biased, 3 modes. This is the case only in this slide. A B
Profiles I (nA) A B Vtip=-8.0 V Vcgate=-1.0 V B=300 mT A B
Profiles I (nA) A B Vtip=-8.0 V Vcgate=-1.0 V B=500 mT A B
Magnetoresistance measurements Stadium voltage
Magnetic focusing 80 mT 100 mT 50 mT
Summary (experimental observations) • Scanning gate microscopy on a quantum point contact: • Imaging electron backscattering • Observation of branches and interference fringes • Detailed investigation of the branching behaviour • Strongly varying interference fringe spacing • Scanning gate microscopy on a ballistic stadium: • Two fringe pattern close to the constrictions • Measurements at high magnetic fields • Proposed model explains some of the observed features, but not all of them