Statistical Process Control (SPC)
Statistical Process Control (SPC). Stephen R. Lawrence Assoc. Prof. of Operations Mgmt Stephen.Lawrence@colorado.edu Leeds.colorado.edu/faculty/lawrence. Process Control Tools. Process Control Tools.

Statistical Process Control (SPC)
E N D
Presentation Transcript
Statistical ProcessControl (SPC) Stephen R. Lawrence Assoc. Prof. of Operations Mgmt Stephen.Lawrence@colorado.edu Leeds.colorado.edu/faculty/lawrence
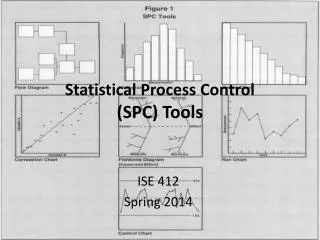
Process Control Tools • Process toolsassess conditions in existing processes to detect problems that require intervention in order to regain lost control. • Check sheets Pareto analysis • Scatter PlotsHistograms • Run Charts Control charts • Cause & effect diagrams
Order Types 7am-9am 9am-11am 11am-1pm 1pm-3pm 3pm-5-pm Emergency Nonemergency Rework Safety Stock Prototype Order Other Check Sheets • Check sheets explore what and where • an event of interest is occurring. Attribute Check Sheet 27 15 19 20 28
Run Charts measurement time Look for patterns and trends…
SCATTERPLOTS x x x x x x xx x x x x xx x x x x x xx x xx x x x x xx x x x x x xx x x x xx xxx x x x x xx xx x x x x xx x x x xxx xx x x x x xxx x x xx x x xx xx x x x x x xx x x xxx xx xx xxx x x xx xxx x x x x x x xx x x x x x x xx x x xx x x xx x x x Variable A Larger values of variable A appear to be associated with larger values of variable B. Variable B
HISTOGRAMS A statistical tool used to show the extent and type of variance within the system. Frequency of Occurrences Outcome
A B C D E F G H I J PARETOANALYSIS A method for identifying and separating the vital few from the trivial many. Percentage of Occurrences Factor
CPU Chip Inspection Pins not Assigned Received Defective Classification Error Defective Pins Damaged in storage Condition Procedures and Methods Maintenance Speed Training Employees Equipment CAUSE & EFFECT DIAGRAMS BAD CPU
Special Cause Common Cause Management Employee Controlled Variation Management Management Uncontrolled Variation Deming’s Theory of Variance • Variation causes many problems for most processes • Causes of variation are either “common” or “special” • Variation can be either “controlled” or “uncontrolled” • Management is responsible for most variation Categories of Variation
Causes of Variation Process variation... What prevents perfection? • Exogenous to process • Not random • Controllable • Preventable • Examples • tool wear • “Monday” effect • poor maintenance Natural Causes Assignable Causes • Inherent to process • Random • Cannot be controlled • Cannot be prevented • Examples • weather • accuracy of measurements • capability of machine
Specification vs. Variation • Product specification • desired range of product attribute • part of product design • length, weight, thickness, color, ... • nominal specification • upper and lower specification limits • Process variability • inherent variation in processes • limits what can actually be achieved • defines and limits process capability • Process may not be capable of meeting specification!
Process Capability Process variation LSL Spec USL Capable process (Very) capable process Process not capable
Measure of capability of process to meet (fall within) specification limits Take “width” of process variation as 6 If 6 < (USL - LSL), then at least 99.7% of output of process will fall within specification limits Process Capability LSL Spec USL 6 99.7% 3
Process Capability Ratio • If Cp > 1.0, process is... capable • If Cp < 1.0, process is... not capable Define Process Capability RatioCp as
Process Capability -- Example A manufacturer of granola bars has a weight specification 2 ounces plus or minus 0.05 ounces. If the standard deviation of the bar-making machine is 0.02 ounces, is the process capable? • USL = 2 + 0.05 = 2.05 ounces • LSL = 2 - 0.05 = 1.95 ounces • Cp = (USL - LSL) / 6 • = (2.05 - 1.95) / 6(0.02) • = 0.1 / 0.12 • = 0.85 Therefore, the process is not capable!
Process Centering LSL Spec USL Capable and centered Capable, but not centered Not capable, and not centered
LSL=1.95 2.0 USL=2.05 Process Centering -- Example For the granola bar manufacturer, if the process is incorrectly centered at 2.05 instead of 2.00 ounces, what fraction of bars will be out of specification? Out of spec! 50% of production will be out of specification!
If Cpk > 1.0, process is... Centered & capable If Cpk < 1.0, process is... Not centered &/or not capable Process Capability Index Cpk Std dev Mean m
Cpk Example 1 A manufacturer of granola bars has a weight specification 2 ounces plus or minus 0.05 ounces. If the standard deviation of the bar-making machine is s = 0.02 ounces and the process mean is m = 2.01, what is the process capability index? • USL = 2.05 oz LSL = 1.95 ounces • Cpk = min[(m -LSL) / 3 , (USL- m) / 3 ] • = min[(2.01–1.95) / 0.06 , (2.05 – 2.01) / 0.06] • = min[1.0 , 0.67] • = 0.67 Therefore, the process is not capableand/or not centered !
Cpk Example 2 Venture Electronics manufactures a line of MP3 audio players. One of the components manufactured by Venture and used in its players has a nominal output voltage of 8.0 volts. Specifications allow for a variation of plus or minus 0.6 volts. An analysis of current production shows that mean output voltage for the component is 8.054 volts with a standard deviation of 0.192 volts. Is the process "capable: of producing components that meet specification? What fraction of components will fall outside of specification? What can management do to improve this fraction?
Process Control Charts Statistical technique for tracking a process and determining if it is going “out to control” • Establish capability of process under normal conditions • Use normal process as benchmark to statistically identify abnormal process behavior • Correct process when signs of abnormal performance first begin to appear • Control the process rather than inspect the product!
Process Control Charts Upper Spec Limit Upper Control Limit 6 Target Spec 3 Lower Control Limit Lower Spec Limit
Process Control Charts Look for special cause ! In control Out of control ! Back incontrol! UCL Target LCL Time Samples Natural variation
When to Take Action • A single point goes beyond control limits (above or below) • Two consecutive points are near the same limit (above or below) • A run of 5 points above or below the process mean • Five or more points trending toward either limit • A sharp change in level • Other erratic behavior
Samples vs. Population Sample Distribution Population Distribution Mean
Types of Control Charts • Attribute control charts • Monitors frequency (proportion) of defectives • p - charts • Defects control charts • Monitors number (count) of defects per unit • c – charts • Variable control charts • Monitors continuous variables • x-bar and R charts
1. Attribute Control Charts • p - charts • Estimate and control the frequency of defects in a population • Examples • Invoices with error s (accounting) • Incorrect account numbers (banking) • Mal-shaped pretzels (food processing) • Defective components (electronics) • Any product with “good/not good” distinctions
Using p-charts • Find long-run proportion defective (p-bar) when the process is in control. • Select a standard sample size n • Determine control limits
p-chart Example Chic Clothing is an upscale mail order clothing company selling merchandise to successful business women. The company sends out thousands of orders five days a week. In order to monitor the accuracy of its order fulfillment process, 200 orders are carefully checked every day for errors. Initial data were collected for 24 days when the order fulfillment process was thought to be "in control." The average percent defective was found to be 5.94%.
2. Defect Control Charts • c-charts • Estimate & control the number of defects per unit • Examples • Defects per square yard of fabric • Crimes in a neighborhood • Potholes per mile of road • Bad bytes per packet • Most often used with continuous process (vs. batch)
Using c-charts • Find long-run proportion defective (c-bar) when the process is in control. • Determine control limits
2. c-chart Example Dave's is a restaurant chain that employs independent evaluators to visit its restaurants as secret shoppers to the asses the quality of service. The company evaluates restaurants in two categories, food quality, and service (promptness, order accuracy, courtesy, friendliness, etc.) The evaluator considers not only his/her order experiences, but also evaluations throughout the restaurant. Initial surveys find that the total number of service defects per survey is 7.3 when a restaurant is operating normally.
3. Control Charts for Variables • x-bar and R charts • Monitor the condition or state of continuously variable processes • Use to control continuous variables • Length, weight, hardness, acidity, electrical resistance • Examples • Weight of a box of corn flakes (food processing) • Departmental budget variances (accounting • Length of wait for service (retailing) • Thickness of paper leaving a paper-making machine
x-bar and R charts • Two things can go wrong • process mean goes out of control • process variability goes out of control • Two control solutions • X-bar charts for mean • R charts for variability
Mean not Centered Increased Variability Problems with Continuous Variables “Natural” Process Distribution Target
Range (R) Chart • Choose sample size n • Determine average in-control sample ranges R-bar where R=max-min • Construct R-chart with limits:
Mean (x-bar) Chart • Choose sample size n (same as for R-charts) • Determine average of in-control sample means (x-double-bar) • x-bar = sample mean • k = number of observations of n samples • Construct x-bar-chart with limits:
R and x-bar Chart Example Resistors for electronic circuits are being manufactured on a high-speed automated machine. The machine is set up to produce resistors of 1,000 ohms each. Fifteen samples of 4 resistors each were taken over a period of time when the machine was operating normally. The average range of the samples was found to be R-bar=21.7 and the average mean of the samples was x-double-bar=999.1.
When to Take Action • A single point goes beyond control limits (above or below) • Two consecutive points are near the same limit (above or below) • A run of 5 points above or below the process mean • Five or more points trending toward either limit • A sharp change in level • Other statistically erratic behavior
Control Chart Error Trade-offs • Setting control limits too tight (e.g., m ± 2) means that normal variation will often be mistaken as an out-of-control condition (Type I error). • Setting control limits too loose (e.g., m ± 4) means that an out-of-control condition will be mistaken as normal variation (Type II error). • Using control limits works well to balance Type I and Type II errors in many circumstances. • 3s is not sacred -- use judgement.