Understanding Trophic Structure and Food Chains in Ecosystems
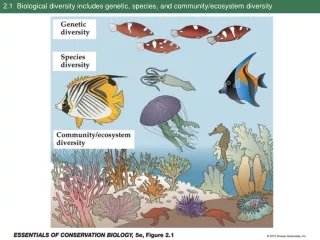
Trophic structure illustrates the feeding relationships within ecosystems and the flow of energy through food chains. Arrows in food chains indicate energy flow direction, and ecosystems typically comprise multiple interconnected food chains, known as food webs. Decomposers play a crucial role by breaking down organic remains, recycling nutrients back into the ecosystem. This overview also discusses energy loss at trophic levels, the significance of biomass and production pyramids, and the impacts of toxins on food chains through bioaccumulation and biomagnification.


Understanding Trophic Structure and Food Chains in Ecosystems
E N D
Presentation Transcript
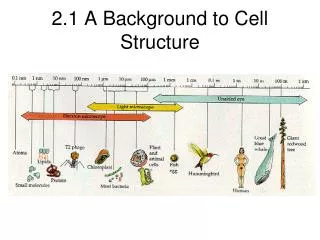
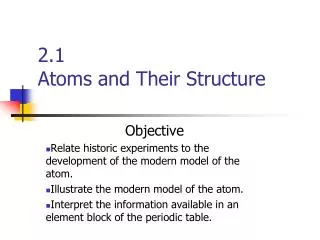
2.1 Ecosystem Structure IBESS
Trophic structure and food chains • Trophic structure is shows the different feeding relationships in an ecosystem. • A food chain shows trophic levels and indicates the flow of energy in the feeding relationship. • In a food chain, the arrows always point in the direction of energy flow.
Food chain in a Taiga forest Secondary consumer Primary consumer Producer What would you call the trophic level of something that ate the lynx? Sun
Ringed seal Baltic cod Sprat
Normally ecosystems are made up of more than one food chain…they are food webs.
We can’t forget decomposers! • Decomposers have the important role of feeding on the remains or wastes of other organisms. • Many bacteria and fungi are decomposers.
Aquatic Ecosystems • When we eat fish, we tend to consume at a higher trophic level than when we consume other animals. • The fish that we tend to eat is high on the food chain…phytoplankton --> zooplankton--> sprat--> cod--> us…
Tertiary consumers Microorganisms and other detritivores Secondary consumers LE 54-2 Primary consumers Detritus Primary producers Heat Key Chemical cycling Sun Energy flow
Energy flow in ecosystems • The energy in an ecosystem generally starts with the sun. • Plants and other organisms use that to make food through photosynthesis. • Energy is then transferred up the food chain. Energy flow
Why a pyramid? • Between the trophic levels, about 90% of the energy is lost to the environment, usually as heat. Energy lost as heat
More on pyramids • Three types of pyramids you should know • Pyramid of numbers • Pyramid of biomass • Pyramid of production
Pyramids of Numbers • The size of each block is proportional to the number of individual organisms present in that trophic level. • Because of the drop in energy at each trophic level, the number of predators is generally much lower than the trophic level below.
Pros and cons • Pros • Easy method to give overview • Good for comparing changes in population numbers over different times/seasons • Cons • All organisms are included regardless of size or energy contained (a beetle takes up as much room as a hippo) • Where to assign omnivores?
Pyramids of Biomass • Each tier represents the standing crop (total dry weight of all organisms) in one trophic level. • Most biomass pyramids narrow sharply from primary producers at the base to top-level carnivores at the apex because energy transfers between trophic levels are so inefficient. Shown in grams per meter squared (gm-2) or sometimes in Joules (J).
Pros and cons • Pros • Takes into account size, so beetles don’t take up as much room as a hippo, better representing the energy in each. • Cons • Only uses samples from populations, so measurement isn’t exact. • Organisms must be killed to measure dry mass. • Organisms with the same mass might not have the same energy available. (fats v. carbs….) • Where to assign omnivores? • Time of year biomass is measured can greatly affect mass.
Inverted Biomass Pyramid Some aquatic ecosystems might show an inverted biomass pyramid because phytoplankton grows, reproduces, and is consumed quickly. Because of this they can support a zooplankton population larger than their own biomass…but the production pyramid is still bottom heavy.
Pyramids of production • The loss of energy with each transfer in a food chain is represented by this pyramid. • Trophic levels are stacked in blocks with primary producers forming the foundation of the pyramid. • The size of each block is proportional to the net production, expressed in energy units per square meter per year (Jm-2yr-1)
Pyramid of Production Joules per square meter per year: Jm-2yr-1 m-2yr-1 m-2yr-1 m-2yr-1 m-2yr-1
Pros and cons • Pros • Productivity are rates of flow, where biomass are stores at one time. • Shows actual energy transferred. • Energy from solar radiation can be added. • Cons • Difficult and complex to collect energy data as the rate of biomass production is needed over time. • Like other pyramids…where to assign omnivores???
Feeding the World • Which takes more land, eating plants or animals? • Which takes more fuel? • Which takes more water?
Toxins in the Environment • Humans release many toxic chemicals, including synthetics previously unknown to nature • In some cases, harmful substances persist for long periods in an ecosystem • When organisms ingest toxins that they can’t excrete or get rid of, they accumulate in their bodies over time (bioaccumulation) • One reason toxins are harmful is that they become more concentrated in successive trophic levels • In biological magnification, toxins concentrate at higher trophic levels, where biomass is lower (biomagnification)
Herring gull eggs 124 ppm LE 54-23 Lake trout 4.83 ppm Concentration of PCBs Smelt 1.04 ppm Zooplankton 0.123 ppm Phytoplankton 0.025 ppm
Practice 1 • An ecosystem consists of one oak tree on which 10 000 herbivores are feeding. These herbivores are prey to 500 spiders and carnivorous insects. Three birds of the same species are eating these spiders and carnivorous insects. The oak tree has a mass of 4000 kg, the herbivores insects have an average mass of 0.05 g, the spiders and carnivorous insects have an average mass of 0.2 g and the three birds have an average mass of 10 g. • Construct, to scale, pyramids of numbers and biomass
#s, 1, 10 000, 500, 3 • Mass, 4 000 000 g, 500 g, 100 g, 30 g
Practice 2 • Assuming an ecological efficiency of 10%, 5%, and 20% respectively, what will be the energy available at the tertiary consumer level (4th trophic level, given a net primary productivity of 90 000 kJ m-2 yr-1? • What percentage is this figure of the original energy value at the primary producer level?
9000, 450, 90 • 0.1
Practice 3 • In an aquatic ecosystem, plankton are eaten by minnows, which are eaten by pickerel, which are eaten by cormorants. • DDT (a toxin) is introduced into the ecosystem and after ten years is found in the following concentrations. Water (0.00005), Plankton (0.04), Minnow (0.23), Pickerel (1.33), Cormorant (26.4). • How many trophic levels are there in this food chain? • How many times more concentrated is the DDT in the body of the cormorant than in the water?
4 • 528 000
Describe the habitat, niche, population, community, and ecosystem for one of the species in this diagram.
Types of relationships between populations • Competition • Predation • Symbiosis • Mutualism • Commensalism • Parasitism.
Competition • When more than one individual or population tries to use the same limited resource. • This picture is hyenas and vultures on the African savannah competing for a carcass.
Predation • When one animal captures and eats another animal for food. • This owl is about to make a meal of this mouse.
Symbiosis • Symbiosis is a close relationship between two species. • There are many types of symbiosis including mutualism, commensalism, and parasitism.
Mutualism • When both species benefit from the relationship. • These yellow billed oxpeckers are getting a yummy meal of ticks and other bugs, the rhino is getting the itchy, blood- sucking, annoying bugs removed.
Commensalism • When one species benefits and the other is unaffected. • Nemo is getting protection from living in the sea anemone, the anemone doesn’t benefit, but it also isn’t bothered.
Parasitism • Parasitism is when one species benefits and the other is harmed. • Why is this songbird so much smaller than the baby it is feeding? Brown-headed cowbirds lay their eggs in other birds nest so they do the taking care of…the baby cowbirds will go as far as to push the songbird’s babies out of the nest for more food.