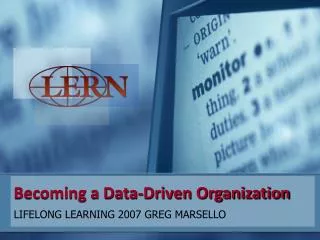
Building a Data-Driven Strategic Enrollment Management Organization
1.59k likes | 1.74k Vues
This presentation explores the principles and practices of Strategic Enrollment Management (SEM) as a vital component of contemporary higher education. Key topics include defining SEM, developing a comprehensive SEM plan, environmental scans, and case studies demonstrating successful implementations. It emphasizes the necessity of collaboration among faculty and staff, the role of the Chief Enrollment Manager, and adapting to rapidly changing student market needs. Participants will gain insights into enrollment strategies that address academic quality, student retention, and the effective use of data.

Building a Data-Driven Strategic Enrollment Management Organization
E N D
Presentation Transcript
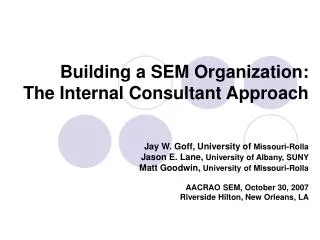
Building a SEM Organization as a Data Driven Consultant Jay W. Goff Vice Provost and Dean for Enrollment Management Larry Gragg, PhD History Department Chair and Professor Robert Montgomery, PhD Psychology Professor & former Department Chair www.enrollment.mst.edu Enrollment Planners Conference, Chicago, IL July 15, 2009
OVERVIEW • SEM Primer: What is Strategic Enrollment Management • Creating the SEM Plan • SEM Case Study & Results • Environmental Scan • Positioning SEM for Success: the In-House Consultant (IHC) Performance Paradigm • Using SEM to Build Stronger Faculty and Staff Collaboration • Q&A
The External Environment Colleges and Universities Operate is Changing Quickly • Dramatic changes in student markets. • Public expectations for a wide variety of high quality student services. • Greater needs for an institution-wide understanding of how to best react to the emerging student trends, needs and markets.
What is SEM? • Strategic Enrollment Management (SEM) is defined as “a comprehensive process designed to help an institution achieve and maintain the optimum recruitment, retention, and graduation rates of students where ‘optimum’ is designed within the academic context of the institution. As such, SEM is an institution-wide process that embraces virtually every aspect of an institution’s function and culture.” Michael Dolence, AACRAO SEM 2001 • Research • Recruitment • Retention
Today’s Enrollment Manager • “Successful senior enrollment managers have to operate simultaneously on multiple levels. They need to be up to date, even on the cutting edge of technology, marketing, recruitment, the latest campus practices to enhance student persistence, and financial aid practices.” SOURCE: THE ENROLLMENT MANAGEMENT REVIEW Volume 23, Issue 1 Fall, 2007, Editor: Don Hossler Associate Editors: Larry Hoezee and Dan Rogalski
ROLE OF THE CHIEF ENROLLMENT MANAGER • Enrollment leaders serve many roles throughout the change management process, such as that of a visionary, encourager, storyteller, facilitator, arbitrator, problem solver, manager and coach. (Black, 2003) • CEMs are Systems Thinkers Adept at Influencing Change Adopted from SEM WP Works 2009
The only person who likes change is a wet baby. Attributed to Mark Twain
Core enrollment principles No Enrollment Effort is Successful without QUALITY Academic Programs to Promote Recruitment and Retention is an On-going, Multi-year PROCESS with Strong Access to Research and DATA +80% of Enrollments come from REGIONAL student markets for BS/BA degrees The Most Successful Recruitment Programs Clearly DIFFERENTIATE the Student Experience from Competitor’s Programs The Most Successful Retention Programs Clearly Address Students’ Needs and Regularly ENGAGE Students in Academic and Non-Academic Programs
SEM Fundamentals • SEM is part of Strategic Planning • Context of Setting Enrollment Goals • Alignment with the College’s/University’s Vision, Mission, Values, and Goals • Factors of Enrollment Planning • Enhancing the Educational Experience for Students
Stabilizing Enrollments Reducing Vulnerabilities Aligning EM with Academic Programs Stabilize Finances Optimize Resources Evaluate Strategies and Tactics Improve Services Improve Quality Improve Access to Information SEM Strategies Adapted from Jim Black, 2003
SEM Organizational Structure and Orientation STRUCTURE: • What type of leader and units are included in a SEM organization ORIENTATION: • Academic vs. Student Affairs vs. Budget vs. Marketing/Development vs. ????
Pricing Institutional Research Strategic Planning Admission & Recruitment Academic Policies Housing Alumni and Development Teaching & Learning Mental Health Services Campus Life Social Support Programs Assessment of Student Learning Student Success Academic Support Programs Career Planning Institutional Policies External Engagement Marketing Institutional Effectiveness Records and Registration Financial Aid Budgeting Academic Programs SOURCE: Bob Wilkinson
Organization Structure Demonstrates Commitment to SEM SOURCE: Bob Bontrager, AACRAO SEM 2003
SEM/CEM Officer: a Cabinet-level Position Enrollments and projections influence: • Profile & appeal of academic programs • Budgets and fiscal stability • Faculty positions and morale • Need for staff and types of support programs • Ultimately enrollments serve as a prime measure of how well an institution is ful-filling its mission.
Faculty from each division Admissions Registrar Financial Aid Campus Housing Student Activities Counseling Center Orientation Teacher Training Director Faculty Senate Leaders Execs: Academic, Student & Enrollment Affairs Advising Info Tech Institutional Research Minority Programs International Affairs Cashier/Billing Pre-College Programs Reporting Services SEM Teams NOTE: SEM Teams do not replace the campus recruitment & retention committees
Key Components to SEM Steps fundamental to starting SEM • Determine the institution’s capacity to serve students by degree program and types of students (traditional, non-traditional, graduate, etc.) • Establish Goals: need to be agreed upon by all involved • Formulate Strategies based on data • Develop action plans with tactics & operational calendar: • What exactly is going to be done • When will it be completed • Who is responsible • How much will it cost • How will you know if it has been accomplished (evaluation)
What is included in a SEM Plan? • Strategic Framework: Mission, Values, Vision • Overview of Strategic Plan Goals & Institutional Capacity • Environmental Scan: Market Trends & Competition Analysis • Evaluation and Assessment of Position in Market • Enrollment Goals, Objectives, & Assessment Criteria • Marketing and Communication Plan • Recruitment Plan • Retention Plan • Student Aid and Scholarship Funding • Staff Development and Training • Student/Customer Service Philosophy • Process Improvements and Technology System Enhancements • Internal Communication and Data Sharing Plan • Campus wide Coordination of Enrollment Activities
Traditional Core SEM Objectives Establishing Clear Enrollment Goals and Determining Capacity to Serve Promoting Student Success Determining, Achieving and Maintaining Optimum Enrollment Enabling the Delivery of Effective Academic Programs Generating Tuition Enabling Financial Planning Increasing Organizational Efficiency Improving Service Levels
Basic Analysis for SEM • Capacity Study • Preferred New Student Profile • Primary Market Penetration • Price Elasticity • Un-met Need Gap (key for fundraising) • Student Need/Support Alignment
Recruitment Plan I. Introduction and Objectives • Institutional Mission, Vision and Goals • Institutional Desired Student Profile & Capacity • Strategic Plan/Overall Institutional Enrollment Goals • Recruitment Leadership and Organization II. Environment Scan and Market Analysis • Recruitment Data of last Five Cohorts • Yield Data by Effort, Student Type, Region and Degree Program • Situation Analysis • Competition and Market Data • Demographic and Psychographic Trends II. Goals • Key Target Markets • New Student Enrollment Goals by Student Market, Type and Profile • Department and Program Goals III. Tactics and Action Plans • Technology Use & Media Strategy by Target Market • Inquiry Management • Territory Management • Financial Aid and Scholarship Distribution • Communication Plans and Relationship Management • Campus Events, Tours and Activities • Faculty and Campus Involvement Plan • Alumni and Volunteer Involvement Plan • Yield Strategies & Orientation Services • Resource Requirements IV. Assessment and Evaluation • New Student Enrollment Comparison Reports • Annual Enrollment Yield Studies (inquiries to enroll, admit to enroll, also by market, recruitment activity, degree program, etc) • New Student and Graduating Student Surveys • Enrollment Compared to Competition
Retention Plan I. Introduction and Objectives • Institutional Mission, Vision and Goals • Institutional Commitment to Student Success • Institutional Desired Student Profile & Capacity • Retention Committee Charge • Philosophy of Student Success • Persistence Data of last Five Cohorts • Campus Assessment Data II. Goals • Institutional Enrollment Goals (size, profile, financial aid/revenue, etc) • Recruitment Goals • Student Retention Goals (1st-2nd year, 2-3rd year, 3 or 6 year graduation rate) • Course Goals (% of students passing) • Student Outcomes Goals (% employed or continuing education w/in 6 months) • Student Satisfaction Goals III. Tactics and Action Plans • Messaging and Communicating Expectation in Recruitment Phase • Orientation Services • Financial Aid and Scholarship Distribution • Academic Advising and Academic Support Programs • First and Second-year Support Programs • Early Warning System and Mid-Term Grade Policy • Interventions for Classes & Majors will high failure levels • Student Activities & Campus Life • Engagement and Community Building Programs • Resource Requirements IV. Assessment and Evaluation • Annual Retention/Attrition Studies • New Student and Graduating Student Studies • Student Satisfaction Studies • Institutional Priorities Studies • Exit Interviews and Non Re-enrollee Studies • Program Audits and Reviews • Academic Standards Review ADAPTED FROM: Successful Retention Planning, Lana Low, June 28, 1999, noellevitz.com
SEM Research Plans • To improve retention • To build relationships with high schools and community colleges • To target admissions efforts and predict enrollments • To recommend changes to admissions policy • To examine issues of how best to accommodate growth • To improve the educational experience of students • To identify needs of unique student groups • To project and plan for student enrollment behavior • To determine financial aid policies • To assess student outcomes
Easy Benchmarking • Determine Competitors & Comparators • www.collegeresults.org • College Board: Institutional Comparison • US News (United States) • McCleans (Canada) • Higher Ed Times (Great Britain) • Shanghi Jiaotong (China)
Comparative sources IPEDS: nces.edu.gov/ipedspas U.S. News & World Report Common Data Set: www.commondataset.org AAU Data Exchange: www.pb.uillinois.edu/AAUDE HEDS: www.e-heds.org The Consortium for Student retention Data Exchange: www.occe.ou.edu/csrde HigherEdInfo.org: www.higheredinfo.org Measuring Up: measuringup.highereducation.org National Student Clearinghouse: www.studentclearinghouse.org ACT: www.act.org College Board: www.collegeboard.com PERL: perl.mhec.org
Outward-looking data U.S. Bureau of Labor Statistics State Offices of Economic and Demographic Research U.S. Census, American Fact Finder U.S. Census Bureau, County-to-County Worker Flow Files Internal Revenue Service, State and County Gross Migration Files U.S. Immigration Service, Yearbook of Immigration Statistics Milken Institute (2003), The Best Performing Cities. www.milkeninstitue.org/research County Office of Urban Planning and Redevelopment State Transportation Departments Measuring Up, The National Report Card on Higher Education Early College High School Initiative, www.earlycolleges.org
SEM at Missouri S&T 2001-2009 RECORD GROWTH DECLINING INTEREST “Succeeding while Swimming Against the Tide”
What is Missouri S&T? • A Top 50 Technological Research University • 6300 students: 4900 Undergrad, 1400 Graduate • 90% majoring in Engineering, Science, Comp. Sci. • Ave. Student ACT/SAT: upper 10% in nation • +60% of Freshmen from upper 20% of HS class • 20% Out of State Enrollment • 95% 5 Year Average Placement Rate • Ave. Starting Salary in 2009: +$57,000
S&T’s Strategic plan Mission The mission of Missouri S&T is to integrate education and research to solve problems for our state and the technological world. Vision The vision of Missouri S&T is to be one of the top five premier technological institutions.
Fall 2008 All Students by Academic Field Missouri S&T: 90% Engineering, Science, & Computing Majors 21st in Nation for Largest Undergraduate Engineering Enrollment (Prism 2008) 23rd in Nation for Number of BS Engineering Degrees Granted (Prism 2009)
RI 1 - 9 students No students 49 Fall 2008 1 5 Legend 7 2 2 21 40 or more students 4 3 15 12 16 10 - 39 students 1 2 15 5 26 11 43 5 21 14 1 430 2 16 22 5 2 DC 58 4,433 124 17 16 9 23 21 Total Enrollment • 47 states & 51 nations • 70% Missouri residents • 10% minority students • 9% international students 54 61 2 6 11 19 16 115 9 3 12
One of America’s great universities • U.S. News: Best colleges as ranked by the High School Counselors at America’s Top 800 high schools: • Missouri S&T ranked 45th Overall • #12 public university • Ahead of, or tied with, every “Big 12” institution • #5 technological research university • #2 in Missouri behind Washington University
One of America’s great universities A Top Public University Missouri S&T ranked 54th among the nation’s top public universities (U.S. News & World Report, 2008 America’s Best Colleges Guidebook, September 2008). Top 15 Public Colleges for Getting Rich #1 in the Midwest! Missouri S&T ranked 12th on Forbes magazine’s list of “Best Public Colleges for Getting Rich” (www.forbes.com, Aug. 2008) Top 20 STEM Research University Missouri S&T named in Academic Analytics’ “Top 20 Specialized Research Universities - STEM” (www.academicanalytics.com, Jan. 2008) Top 25 Starting Salaries #1 in the Midwest! Missouri S&T named in payscale.com’s list of highest average starting salaries for graduates (www.payscale.com, Aug. 2008) Top 25 Entrepreneurial Campus Missouri S&T ranked 22nd on Forbes ‘s list of “America’s Most Entrepreneurial Campuses” (www.forbes.com , Oct. 22, 2004). Top 25 Connected Campus Missouri S&T named in Princeton Review’s “America’s 25 Most Connected Campuses” (www.forbes.com, Jan. 19, 2006). Top 30 Safest College Campuses Missouri S&T ranked #27 in Reader’s Digest’s “Campus Safety Survey” (www.rd.com, 2008). Top 50 Engineering School Missouri S&T ranked 48th among the nation’s best engineering schools (U.S. News & World Report, 2007 America’s Best Colleges Guidebook, September 2006).
Life as a National Outlier Average enrollment is 6,457 Average enrollment is 5,615
PROMOTE OUTCOMES: Starting Salaries UndergraduateGraduate 2003 $ 47,305 $ 52,744 2004 $ 46,567 $ 52,945 2005 $ 49,181 $ 53,042 2006 $ 51,059 $ 58,120 2007 $ 53,669 $ 62,751 2008 $ 55,975 $ 63,640
Ongoing interest declines in key fields Changes in Intended Major 1976-77 to 2006-07 DATA SOURCE: CIRP CHART SOURCE: College Board, 2007
> 5% SOURCE: ACT EIS 2008
Missouri’s 2008 Student Funnel for All Engineering Fields • High School Senior : 72,467 • High School Graduates: 61,752 • ACT Testers/College Bound: 47,240 • Any Engineering Interest (all testers): 1,768 • Any Engineering Interest, (+21 testers): 1,256 (21 = MO average score / 50%) • Engineering Interest, +24 comp. score: 961 (24 = UM minimum for auto admission) • Missouri S&T Freshmen Engineering Enrollees: 681 SOURCES: MODESE 2009, ACT EIS 2008, PeopleSoft
Minimal Markets for Female & Minority EngineersMissouri’s 2008 ACT Tested Seniors, +24 ACT and Interested in Engineering • High School Senior Cohort: 72,467 • High School Graduates: 61,752 • All Engineering Interest, +24 comp. score: 961 (24 = UM minimum for auto admission) • Female Engineering, +24 comp. score: 176 • African-Amer Engineering, +24 comp. score: 21 • Asian-Amer Engineering, +24 comp. score: 25 • Native Amer Engineering, +24 comp. score: 7 • Hispanic Engineering, +24 comp. score: 24
STUDENT RETENTION Since 2004, 60% of Growth due to Retention Increase Graduation Rates 20002005 General Student Body: 52% 64%
Silver Bullet OR Strike of Lightening?
SEM at S&T • Established a Vision • Aligned Systems • Created and Executed Plans • Integrated the Vision • Regularly review the Process
SEM in ACTION: Why Change the University Name? “Missouri S&T will better define the university as a leading technological research university. We believe the new name will help to differentiate this university in a highly competitive university market and provide a national competitive advantage.” Dr. John F. Carney, III Missouri S&T Chancellor