Download
1 / 25
330 likes | 896 Vues
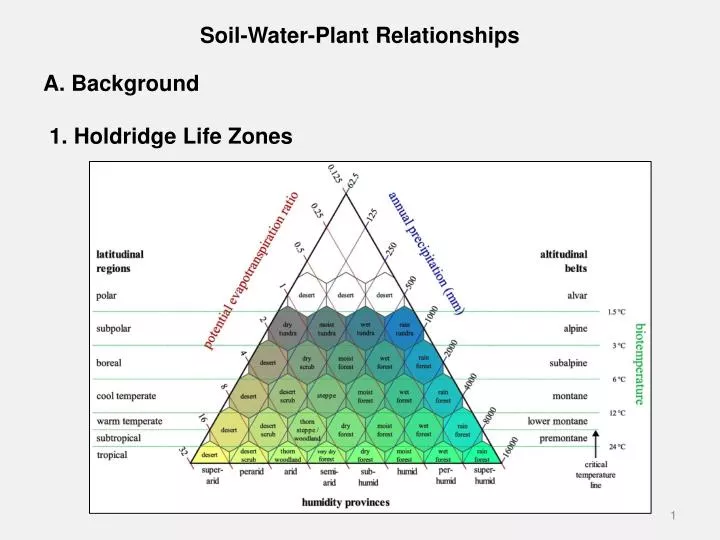
Soil-Water-Plant Relationships A. Background 1. Holdridge Life Zones. 2. Average Annual Precipitation. 3. Arable Land - land that can be used for growing crops 4. Irrigation System Design Factors a. Water-holding capacity of a soil (root zone of the plant)

E N D
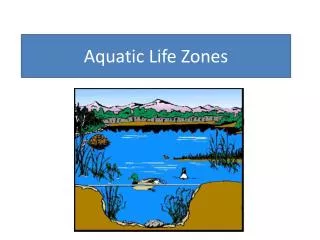
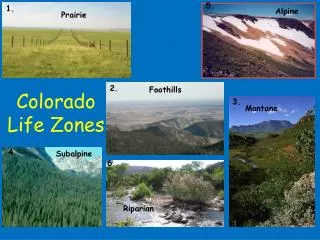
Soil-Water-Plant Relationships A. Background 1. Holdridge Life Zones
3. Arable Land - land that can be used for growing crops 4. Irrigation System Design Factors a. Water-holding capacity of a soil (root zone of the plant) b. Water-intake rate of the soil c. Root system of the crop d. Amount of water that the crop uses e. Rainfall amount and distribution throughout the growing season Understanding soil-plant-water relationships is necessary in order to plan and manage efficiently irrigation for specific crops grown on particular soils and in order to adjust the design to various conditions.
B. Soil Properties 1. Soil Bulk Density, ρb, g/cm3, typical values: 1.1 - 1.6 g/cm3 Ms= dry soil mass, g Vb = soil sample volume, cm3 2. Soil Particle Density, ρp, g/cm3, typical values: 2.6 - 2.7 g/cm3 Vs= solids volume, cm3 3. Porosity, Φ, typical values: 30 - 60% *100%
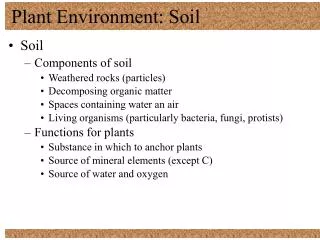
C. Soil Water 1. Terminology a. Water Content, W 1) Dry Weight Basis 2) also called gravimetric water content 3) oven dry means 105 oC until constant weight (≈ 24 hours) b. Volumetric Water Content, θ ρb = soil bulk density, g/cm3 ρw = water density, g/cm3
c. Equivalent Depth of Water D = soil depth, in d = water depth, in3/in2 or in For a volumetric water content, =0.25 D Water d
2. Soil Water Potential a. Description 1) Measure of the energy status of the soil water 2) Reflects how hard plants must work to extract water 3) Units: bars or atmospheres 4) Negative pressures (tension or suction) 5) Water flows from a higher (less negative) potential to a lower (more negative) potential b. Components ψt = total soil water potential ψg = gravitational potential ψm= soil matric potential (soil water "tension") ψo = osmotic potential Matric potential, ψm, usually has the greatest effect on release of water from soil to plants
c. Matric Potential and Soil Texture Tension or suction created by small capillary tubes Small pores create higher suction than large pores For a given matric potential, coarse texture soils (sands) hold LESS water than fine texture soils (silts and clays). Height of capillary rise, h, inversely related to tube diameter h2 h1
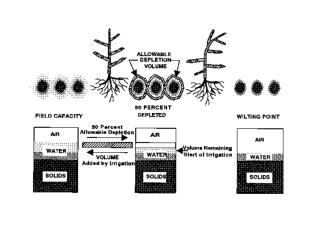
f. Available Water Holding Capacity (AWHC) Amount of water the soil can hold between field capacity and wilting point. Usually in/ft of soil or inches over entire root zone depth. 2) Field Capacity a) Approximation of the amount of water retained by the soil after the initial stage of drainage. b) Less than saturation, ≈ 1/3 bar c) Usually < 48 hours for most soils 3) Wilting Point a) Moisture level in soil where plant cannot remove water b) Function of crop and stage of growth 4) Permanent Wilting Point - plant dies Wilting Point Permanent Wilting Point
g. Available Water Percentage (AWP) • function of soil texture • available water remaining in the root zone at any time • % of AWHC • Field Capacity: AWP = 100% • Wilting Point: AWP = 0% • h. Maximum Allowable Deficiency (MAD) • Maximum soil water depletion allowed • Expressed as % of AWHC • When AWP = 100 - MAD, it is time to irrigate • 50% often used, less for vegetables, more for drought tolerant crops
i. Readily Available Moisture (RAM) portion of available water over which irrigation scheduling occurs, % of MAD RAM = AWHC * MAD when soil is at field capacity
4. Wetting Patterns 1) Vertical movement due primarily to gravity 2) Horizontal movement due primarily to capillarity Coarse Textured Soil Fine Textured Soil
D. Soil Water Measurement 1. Gravimetric a. Measures mass water content ( m) b. Take field samples, weigh, oven dry, weigh Advantages: accurate; multiple locations Disadvantages: labor; time delay 2. Feel and Appearance a. Take field samples b. Feel them by hand Advantages: low cost; multiple locations Disadvantages: experience required; not highly accurate
Appearance at Different Moisture Contents • Sand Clay Loam • Loam • Silt Loam ftp://ftp-fc.sc.egov.usda.gov/MT/www/technical/soilmoist.pdf
3. Neutron scattering (attenuation) a. Measures volumetric water content b. Attenuation of high-energy neutrons by hydrogen nucleus Advantages: - samples a relatively large soil sphere - repeatedly sample same site and several depths - accurate Disadvantages: - high cost instrument - radioactive licensing and safety - not reliable for shallow measurements near surface
4. Dielectric Constant Soil's dielectric constant is dependent on soil moisture Time domain reflectometry (TDR) Frequency domain reflectometry (FDR) Primarily used for research purposes 5. Tensiometers Measure soil water potential (tension) Practical operating range is about 0 to 0.75 bar of tension Limitation on medium- and fine-textured soils
6. Electrical resistance blocks Measure soil water potential (tension) Tend to work better at higher tensions (lower water contents) 7. Thermal dissipation blocks Measure soil water potential (tension) Require individual calibration
F. Irrigation Scheduling 1. Evaporation Methods a. Atmometer b. Pan Evaporation c. ET Equation using weather data d. Using the Agweather Site on MESONET 2. Scheduling Methods http://www.upperbigblue.org
ET Using the Oklahoma MESONEThttp://www.mesonet.org/index.php/agriculture/map/agriculture_essentials/evapotranspiration/short_crop_etos_et_map
Irrigation Planner: Oklahoma MESONEThttp://www.mesonet.org/index.php/agriculture/irrigation_planner
Irrigation Scheduling: Checkbook Method http://www.extension.umn.edu/distribution/cropsystems/components/DC1322b.pdf