Download
1 / 21
240 likes | 840 Vues
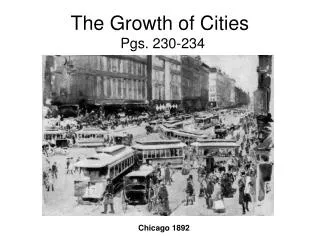
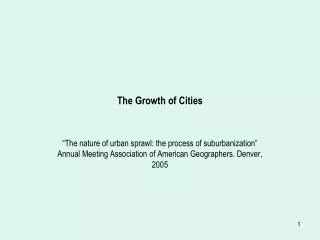
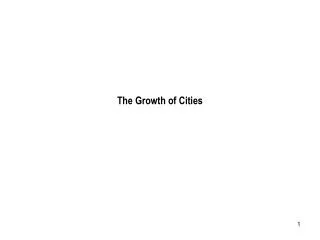
Urbanisation and the growth of Mega Cities. Shanghai – pop 18 million 2010. Urbanisation Growth in the percentage of the population living in urban areas Urban Growth Growth in the size of cities. IS THERE A RELATIONSHIP BETWEEN GNP & URBANIZATION?.

E N D
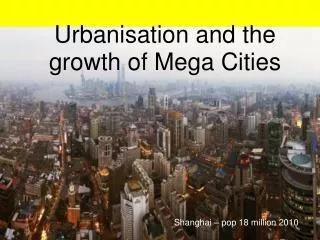
Urbanisation and the growth of Mega Cities Shanghai – pop 18 million 2010
Urbanisation Growth in the percentage of the population living in urban areas Urban Growth Growth in the size of cities
IS THERE A RELATIONSHIP BETWEEN GNP & URBANIZATION? PLOT A SCATTERGRAPH TO SHOW THE RELATIONSHIP.
GUIDING QUESTIONS • What is the relationship between wealth and urbanisation? • Where are the anomalies? (Give examples of countries and data) • Seek to explain the anomalies. • Classify the countries into 3 or 4 categories and explain the logic for your classification. • Explain the overall pattern for the relationship between urbanization and wealth.
There has been examples of more recent rapid urban growth in MEDCs. Japan has been rich enough to invest in the provision of urban services and the development of infrastructure to cope with this growth. Also the population of Tokyo have in general had enough private disposable income to address their needs.
Key Questions Describe and explain the variation in global growth rates and patterns in urbanisation. Explain the global increase in the number and location of megacities. (pop over 10 million)
City 1950 1960 1970 1980 1990 Bogotá 647,429 1,682,667 2,892,668 4,122,978 4,851,000 Buenos Aires 4,622,959 6,739,045 8,314,341 9,723,966 10,886,163 Caracas 683,659 1,346,708 2,174,759 2,641,844 2,989,601 Lima 645,172 1,845,910 3,302,523 4,608,010 6,422,875 Mexico City 3,145,351 5,173,549 8,900,513 13,811,946 15,047,685 Rio de Janeiro 2,885,165 4,392,067 6,685,703 8,619,559 9,600,528a Santiago 1,509,169 2,133,252 2,871,060 3,937,277 4,676,174a São Paulo 2,333,346 4,005,631 7,866,659 12,183,634 15,183,612a Latin America city growth 1950 1990
Lagos - Nigeria China’s urban population 1950 - 290,000 2010 – over 20 million Over the past 50 years, the country’s urban population has increased more than seven-fold, from 72 million in 1952 to 540 million in 2004. If urbanization continues at the rate of 1 percent annually, an estimated 900 million Chinese will live in cities by 2020.
TO BE MEGA-CITIES IN 2015 Country Urban agglomeration 1950 1975 2000 2015 Japan............................ Tokyo 6 920 19 771 26 444 27 190 Bangladesh .................. Dhaka 417 2 173 12 519 22 766 India ............................ Mumbai (Bombay) 2 981 7 347 16 086 22 577 Brazil........................... São Paulo 2 528 10 333 17 962 21 229 India ............................ Delhi 1 391 4 426 12 441 20 884 Mexico......................... Mexico City 2 883 10 691 18 066 20 434 United States ............... New York 12 339 15 880 16 732 17 944 Indonesia ..................... Jakarta 1 452 4 814 11 018 17 268 India ............................ Calcutta 4 446 7 888 13 058 16 747 Pakistan ....................... Karachi 1 028 3 990 10 032 16 197 Nigeria......................... Lagos 288 1 890 8 665 15 966 United States ............... Los Angeles 4 046 8 926 13 213 14 494 China ........................... Shanghai 5 333 11 443 12 887 13 598 Argentina..................... Buenos Aires 5 042 9 144 12 024 13 185 Philippines................... Metro Manila 1 544 5 000 9 950 12 579 China ........................... Beijing 3 913 8 545 10 839 11 671 Brazil........................... Rio de Janeiro 2 965 7 963 10 652 11 543 Egypt ........................... Cairo 2 410 6 079 9 462 11 531 Turkey ......................... Istanbul 1 077 3 601 8 953 11 362 Japan............................ Osaka 4 147 9 844 11 013 11 013 China ........................... Tianjin 2 374 6 160 9 156 10 319
Megacities are often primate cities Primate cities (at least double the pop of the second largest city in the country) are typical of many LEDCs and NICs. The city dominates the country’s urban system and economy. Advantages and disadvantages of primate cities? Nagle 291
World Urbanisation and Mega City - References BBC Special Report – Urban Planet http://news.bbc.co.uk/1/hi/in_depth/world/2006/urbanisation/default.stm Landmark 188/189 Hart 212/213 Nagle 289 – 293 (Primate cities) Pop, Res, Dev 62 (Zelinsky’s Model of Mobility Transition) Atlas data
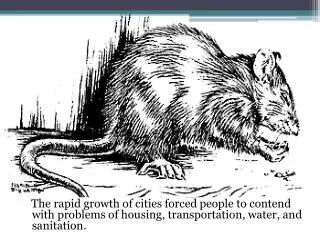
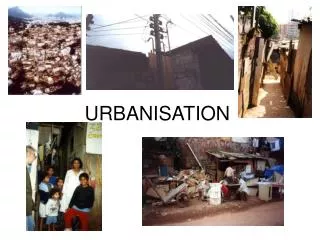
Implications of urbanisation in LEDC’s and NICs Urbanisation is most rapid in LEDC’s and NIC’s because of high natural increase and rural to urban migration. Don’t forget there are many large cities in the world of over 2 or 3 million inhabitants. Don’t just think, mega cities. These cities face the same problems that cities in the UK faced in the nineteenth century. BUT they are not in the same position that the UK was to face the challenge.
Urbanisation and urban growth has to be seen within the contemporary geopolitical and economic context. • Scale of the challenge • Resources available • Terms of trade • Levels of economic growth • External debts • IMF/World Bank restrictions on public spending • Competition • Corruption and political indifference • Polarisation of society • Levels of pollution and resource use
More background reading Access to Geography – page 78-87 Nagle – 289-297 (Cairo) Hart – page 212-246 (Mexico and Beijing) Landmark – 219-225 (Shanghai) Planet Geog – 252 (Shanghai) Changing Environments – 245-252 / 267-277 (Mumbai)