Download
1 / 14
140 likes | 241 Vues
Economics in the medium-run. In developing the AD-AS framework, we developed a model in levels- price levels, output levels and interest rates.

E N D
Economics in the medium-run • In developing the AD-AS framework, we developed a model in levels- price levels, output levels and interest rates. • In the last lecture, we used the labour market equations to derive the Phillips curve- a relationship between growth in price level (inflation) and unemployment. • In this lecture we will complete the transition and develop a model in growth- inflation, output growth, money stock growth and unemployment.
Levels When we were talking in levels, our variables are: Interest rates Output Prices Unemployment Wages Growth When we are talking in growth (percentage change in levels), our variables of interest are: Interest rates Growth in Output Growth in Prices Unemployment Levels versus growth
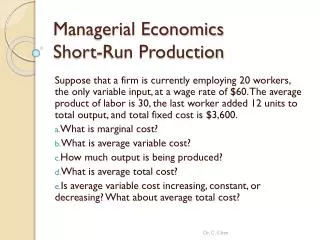
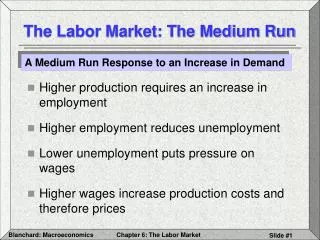
Okun’s Law • Okun’s Law (named after an economist on Kennedy’s Council of Economic Advisors) states that there is a negative linear relationship between growth in output and changes in the unemployment rate. • If economic growth is low, unemployment will rise. • If economic growth is high, unemployment will fall.
Derivation of Okun’s Law Y = Y (N/N) (L/L) Y = (Y/N) (N/L) (L) = (Y/N) (1-u) L Growth in Y = (Growth in Y/N) + (Growth in L) – (Growth in u) • Growth in Y/N has been 1.5% per year in Australia. Growth in L has been 1.9% per year in Australia. (Change in ut) = gYt – 3.4%
Derivation of Okun’s Law • Our best estimate of Okun’s Law is that: ut – ut-1 = -0.5 (gYt – 3.4%) • So if gyt > 3.4%, then unemployment rises, and if gyt < 3.4%, then unemployment falls. • In general: ut – ut-1 = -β (gYt – g*Y) • Intuition: The labour market is growing (in numbers and productivity) every year. Output must grow at least this fast, or the economy will not absorb all of the labour.
Phillips curve • The Phillips curve shows a linear relationship between changes in the inflation rate and changes in the unemployment rate: πt - π te = - α (ut – un) • If inflationary expectations are merely last year’s inflation rate: πt - πt-1 = - α (ut – un) • Where we call 1/α the “sacrifice ratio”, as it represents the number of percent-years of unemployment required to reduce inflation by 1%.
What is a dynamic aggregate demand? • In developing the AD-AS framework, we developed a static model for output and introduced the RBA- treating the RBA as though it had a “target price level”. • But the natural rate of output is growing over time and the RBA does not aim for a price level- instead a target inflation rate. • We want an AD relation in growth of output and growth of prices.
Dynamic aggregate demand • With our previous AD equations, we had two forms: • RBA controls money supply Yt = Y((Mt/Pt), Gt, Tt) • RBA controls interest rates Yt = Y(it, Gt, Tt) • We want to turn equations into “growth” relations.
Growth relations • Growth is the (Change in variable)/(Total of variable). Let gx be the “growth of x”. There are some simple rules we can invoke for growth relationships: A = BC then gA = gB + gC A = B/C then gA = gB – gC • You can prove this with some basic calculus.
RBA controls money supply • RBA controls money supply Yt = Y((Mt/Pt), Gt, Tt) = (Mt/Pt) f(Gt, Tt) • If we hold G and T constant, then they drop out in a growth relation: gYt = gMt – gPt • But gP is just inflation, so we have: gYt = gMt – πt
RBA controls interest rate • RBA controls interest rates Yt = Y(it, Gt, Tt) = Y*t / it • Where Y* is the natural rate of output. gYt = g*Y - git • If the RBA follows an interest rate target then the rule for the RBA might be git = φ(πt – πT) gYt = g*Y - φ(πt – πT)
Model in growth rates • So we have three relations in growth rates: Okun’s Law: ut – ut-1 = -β (gYt – g*Y) Phillips curve: πt - π t-1 = - α (ut – un) DAD: gYt = g*Y - φ(πt – πT) • Or DAD: gYt = gMt – πt • Parameters: g*Y, un, πT , gMt • Variables to be solved: gYt, ut, πt • As these are growth models, we will typically be solving for values of variables over time.
Solution of the model • Unless we want to allow for a solution that spirals away, ie. πt > πt-1 for all t, then we will require that πt = πt-1. • From our Phillips Curve, then ut = un for all t, so through our Okun’s Law, gYt = g*Y for all t. • Our DAD relations will then determine monetary policy. • πt = πT • gMt = g*Y + πT • So to maintain stability in our model, the path of money supply is determined by our targets and parameters.
What is the cause of inflation? • In our solution, we have • πt= gMt - g*Y • Inflation simply depends on how much faster the money supply grows than the natural rate of output growth. • This is what the book means by “Inflation is always and everywhere a monetary phenomenon.” Inflation in the medium-run does not depend oil shocks or wages policy or anything other than the rate of money creation.