Power BI Vs. Tableau - Best Data Visualization Tool
The field of data visualization and analytics is changing at a fast pace, with new competitors entering the market every day and major brands absorbing smaller upstarts. A tool must have a unique mix of strength, ease of use, brand awareness, and price to be at the forefront of the data analytics sector. This secret sauce is included in both of these products, which is why many teams compare Microsoft Power BI vs. Tableau when seeking the best data analytics solution.

Power BI Vs. Tableau - Best Data Visualization Tool
E N D
Presentation Transcript
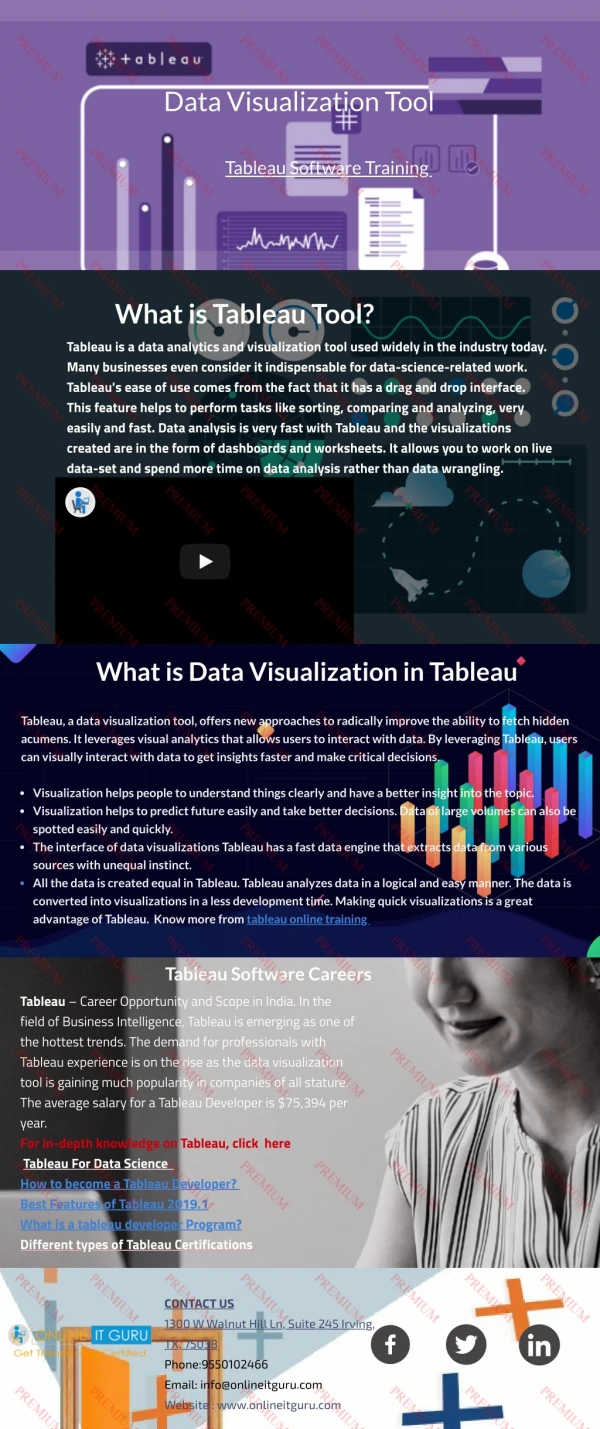
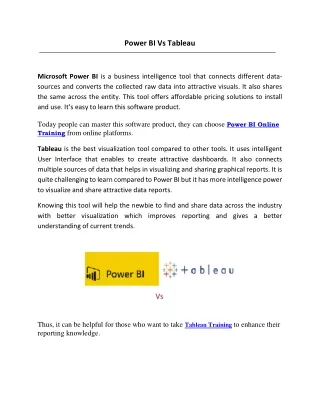
Power BI Vs. Tableau – Comparison of Features The field of data visualization and analytics is changing at a fast pace, with new competitors entering the market every day and major brands absorbing smaller upstarts. A tool must have a unique mix of strength, ease of use, brand awareness, and price to be at the forefront of the data analytics sector. This secret sauce is included in both of these products, which is why many teams compare Microsoft Power BI vs. Tableau when seeking the best data analytics solution. What is Tableau? In the business intelligence market, Tableau is a strong and rapidly developing data visualization application. It enables you to convert raw data into a format that is simple to comprehend. Tableau analyses data quickly and generates representations in the form of dashboards and workbooks. This assists professionals at all levels of a business in comprehending data created with Tableau. What is a Power BI? Power BI is a Business Intelligence and Data Visualization application that allows you to convert data from various data sources into interactive dashboards and business intelligence reports. It also comes with a wide range of software connectors and services. Microsoft Power BI is a business intelligence application that allows you to work with data from the data sources and see it after it has been cleaned and integrated. It also includes the ability to generate Adhoc reports, which helps in data analysis. What to choose? Because of features and capabilities such as Embedded BI, Data Blending, and Multi Data Source Connections such as Cloud databases and on-premise databases, Power BI and Tableau are the most popular solutions among all business intelligence products. They make it simple for users to share information and dashboards. Business Analysts can access information and dashboards and make critical business decisions without even having to use these tools. Power BI has the ability to import and create bespoke visuals, which is one of its most appealing features. Due to these factors, these BI solutions have become the most popular BI tools on the market to date. Both Power BI and Tableau have their own set of advantages and disadvantages. Touchstones and priorities can be used to select the best product. In the Power BI vs. Tableau discussion, Power BI has the upper hand. Its ease of use, resemblance to Excel, and low cost make it an excellent choice for a wide range of enterprises. Tableau continues to offer distinct advantages that many firms and analysts will value. It's more suitable for massive data sets, has more attractive data visualizations, and has more customization possibilities than Power BI.