Download
1 / 1
10 likes | 133 Vues
Potential use of AVHRR NDVI in estimating crop aboveground biomass and carbon inputs from crop residues. Erandi Lokupitiya 1,2 , Michael Lefsky 3, and Keith Paustian 1,2

E N D
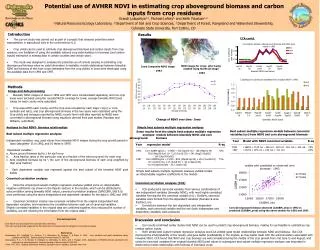
Potential use of AVHRR NDVI in estimating crop aboveground biomass and carbon inputs from crop residues Erandi Lokupitiya1,2, Michael Lefsky3, and Keith Paustian1,2 1 Natural Resource Ecology Laboratory, 2 Department of Soil and Crop Sciences, 3 Department of Forest, Rangeland and Watershed Stewardship, Colorado State University, Fort Collins, CO Introduction Results • The current study was carried out as part of a project that assesses potential carbon sequestration in agricultural soils in the conterminous U.S. • Crop yields can be used to estimate crop aboveground biomass and carbon inputs from crop residues; one limitation of using the available national crop yield statistics for biomass (and carbon inputs) estimation is missing data in certain counties and certain years. • This study was designed to evaluate the potential use of remote sensing in estimating crop aboveground biomass when no yield information is available; model relationships betweenbiweekly NDVI and biomass of the main crops (estimated from the crop yields) in Iowa were developed using the available data from 1992 and 1997. CCA contd. NDVI image for crops- after being masked using the NLCD image - 1992 Iowa Composite NDVI image - 1992 Methods Image and data processing • Biweekly NDVI images of Iowa in 1992 and 1997 were concatenated separately, and non-crop areas were excluded using the recoded NLCD coverage for Iowa; average biweekly NDVI pixel values for each county were calculated. • Crop area within each county, and the crop area occupied by each major crop (i.e. corn, soybean and oats), and crop aboveground biomass in the two years were estimated using the Crop yields and acreages reported by NASS; county level yield data reported by NASS were converted to aboveground biomass using equations derived from past studies (Paustian and Williams, submitted). • Analyses to find NDVI- biomass relationships • Best subset multiple regression analyses • Independent variables- avg. pixel values from biweekly NDVI images during the crop growth period in Iowa (altogether 15 in 1992, and 16 those in 1997) • Dependent variables : • a. Above ground biomass kg ha-1 for each crop • b.Area fraction (area of the particular crop as a fraction of the total crop area) for each crop • Area weighted biomass kg ha-1; the sum of the aboveground biomass of each crop weighted by their area fraction) • Each dependent variable was regressed against the best subset of the biweekly NDVI pixel bands B A E F K G R L M S # Change of NDVI over time- Iowa # Best subset multiple regression models between canonical variables (cv) from NDVI and corn aboveground biomass- ________________________________________________ Year Model with NDVI canonical variables R-sq ____________________________________________________________________________________ 1992 =16653 + 1105 cv1 - 266 cv2 - 283 cv3 - 281 cv5 + 192 cv6 78% 1997 =15723 + 873 cv1 + 234 cv2 + 311 cv4 82% __________________________________________________________________ Simple best subsets multiple regression analyses Some results from the simple best subsets multiple regression analyses- models between biweekly NDVI and corn aboveground biomass ____________________________________________________ Year regression model R-sq ___________________________________________________________________________________________ 1992Corn AGBM kg/ha = - 15426 + 316 (Apr03-16) - 166 (May01-14) 78% - 59.6 (May29-Jun11)+ 71.6 (Jun12-25) + 241 (Aug21-Sep03) - 163 (Sep18-Oct01) 1997 Corn AGBM kg/ha = 15755 - 89.5 (Mar28-Apr10) + 85.2 (Jun06-19) 74% - 76.1 (Jul04-17)+ 117 (Jul18-31) + 44.1 (Sep12-25) - 91.4 (Sep26-Oct09) - 32.7 (Oct10-23) _____________________________________________________________ Simple best subsets multiple regression analyses yielded certain un-interpretable negative coefficients in the models # # Data analysis and imputation procedure • Canonical correlation analyses • Since the simple best subsets multiple regression analyses yielded some un-interpretable negative coefficients (as shown in the Results section) in the models, which can be attributed to autocorrelation among biweekly NDVI values, canonical correlation analyses (CANCORR, SAS 9.0) were performed using the above independent and dependent variables for the data in 1992 and 1997. • Canonical correlation creates new canonical variables from the original independent and dependent variables, and maximizes the correlation between each set of canonical variables. • (Highly correlated variables in the original data are combined together, thus reducing the number of variables, but still retaining the information from the original data.) Canonical correlation analyses (CCA) • CCA produced 8 canonical variables from various combinations of raw independent variables (biweekly NDVI), with most highly correlated variables forming the first canonical variable (cv1). Similarly, canonical variables were formed from the dependent variables (biomass & area fraction), too. • Correlations between the raw dependent and independent variables, each canonical variable and the raw (both independent and dependent) variables were produced. Corn aboveground biomass observed (CAGBM_obs) in 1992 vs predicted (CAGBM_pred) using the above models for 1992 and 1997. Acknowledgements Sunil Kumar and Kay Dudek from Colorado State University. This work was financially supported by the Consortium for Agricultural Soil Mitigation of Greenhouse Gases. References Doraiswamy, P.C., Hartfield, J.L., Jackson, T.J., Akhmedov, B., Prueger, J., & Stern, A. 2004. Crop condition and yield simulations using Landsat and MODIS. Remote sensing of environment 92:548-559 Doraiswamy, P. C., T. R. Sinclair, S. Hollinger, B. Akhmedov, A. Stem, and J. Prueger. 2005. Application of MODIS derived parameters for regional crop yield assessment. Remote Sensing of Environment 92:192-202. Timm, N.H. 2002. Applied multivariate Analysis. Springer texts in statistics. Springer. New York. Discussion and conclusion • Our results confirmed earlier studies that NDVI can be used to predict crop aboveground biomass, making its use feasible in estimating crop residue carbon inputs. • Both simple best subset multiple regression analyses and CCA yielded good model relationships between NDVI and biomass. But CCA improved the interpretability of the results, and gave better predictability in the models, as they better dealt with the autocorrelation associated with biweekly NDVI. CCA found that NDVI and crop biomass are well correlated during the middle of the crop growth from mid June to end August, and using the canonical variables from original biweekly NDVI pixel values in subsequent best subset multiple regression analyses was important in determining model relationships with biomass of individual crops.