
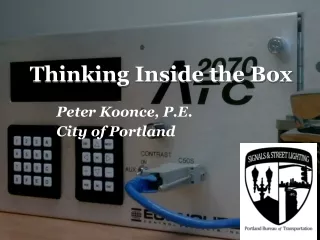
Thinking Inside the Box
Thinking Inside the Box. Peter Koonce, P.E. City of Portland. Presentation Outline. Call to Action Highway Capacity Manual Construct for Data Collection In the Loop History. Why We’re Here Today. Traffic signals are a big part of the work that we do Need to Improve Management


Thinking Inside the Box
E N D
Presentation Transcript
Thinking Inside the Box Peter Koonce, P.E. City of Portland
Presentation Outline • Call to Action • Highway Capacity Manual Construct for Data Collection • In the Loop History
Why We’re Here Today • Traffic signals are a big part of the work that we do • Need to Improve • Management • Traffic Monitoring and Data Collection
HCM Capacity Definition • Capacity, c (lower case) depends fundamentally on • the saturation flow rate, s, of the lane • Saturation flow rate assumes the maximum rate of flow that can pass through the lane group under prevailing traffic and roadway conditions (expressed in units of vehicles per hour of effective green) • green per cycle is g/C: • Where g is the green time for a movement and C (capital C) is the cycle length • g/c is the effective green per cycle (expressed as a percentage) c = s (g/C) 2.1.3
HCM Capacity Analysis Calculation where i is the various movement or “phase” 2.1.3
2 3 4 1 5 6 7 8 HCM Capacity Analysis • Considering the control of a signalized intersection over time you can start to consider how much time is associated with each traffic flow Time 2.1.3
Use of Loops for Counting • Vehicle Counts from a single long loop or multiple loops in a single lane • Vehicle Classification and Speed • Vehicle Tracking • Loop Diagnostics Source: Reno A&E
What would additional data do? Enhanced response to customers Reduced liability Prioritizing our efforts
What should the information be? Effective performance measures should be applicable to the users, easy to calculate, accurate, and clearly and consistently interpreted
Sample MOEs from NWS Voyage • Signal controllers have the ability to collect information • Phase service Y/N • Ped service Y/N • Average Green 11
Number of pedestrian calls • Assists in signal retiming • Helps in knowing potential for a pedestrian resulting in longer side street demand • Identifies periods of high demand
Performance Measures for a Phase • Measure volume + • Measure green time • Yields an estimate of capacity • Identify where split adjustments are helpful 1.0 Volume/capacity 24:00 12:00 0:00 0.0 Source: Day, C., E. Smaglik, D.M. Bullock, and J. Sturdevant, ” Cycle Length Performance Measures: Revisiting and Extending Fundamentals,” Paper ID: TRB 09-0061, in press.
Preemption and Priority Reports • Preemption • Rail • Emergency Vehicle • Priority • Bus Operations • Other Modes
Integration of Detection and Controller • Recent research at Purdue University has linked detector activity with controller information • The Purdue Coordination Diagram (PCD) collects • arrival time of each vehicle at an intersection • information about the phase state (red and green intervals)
24-Hour Plot of Intersection Saturation • 1,2 | 3,4 • Virtually no slack Capacity • 5,6 | 3,4 • Extra Capacity, opportunity to reduce C Source: Day, C., E. Smaglik, D.M. Bullock, and J. Sturdevant, ” Cycle Length Performance Measures: Revisiting and Extending Fundamentals,” Paper ID: TRB 09-0061, in press. 16
In the Loop What it is • … The inclusion of a specific traffic controller software in a simulation or model. Why Is it Done • Improve Accuracy • Test advanced features • Reduce uncertainty
Example • SW Moody/SW Porter Transit/Auto intersection • Anticipation of 24 preemption calls • Requirement of lead-in/lead-out phases • Uses all 16 signal channels to accommodate the various modes • Cars – 1500+ PM Peak by 2035 • LRT & SC – 40 movements by 2035 • Bus – 40-50 PM Peak by 2035 • Peds & Bikes 300-700 PM Peak by 2035 • Will be one of the most unique intersections in Portland • Mistakes at the design phase will be expensive to fix later • Or will cost operating time at the intersection
SW Moody/Porter • Using HIL we were able to • Test & refine signaling plans • Additional intersection clearance time • Checkouts to prevent track fouling • Understanding how the intersection will recover • Understand the likely operation of the intersection • Using VISSIM we modeled the intersection using a COP 2070 controller to understand how the installed equipment will function
Questions Thanks for participating Peter Koonce, P.E.Principal Engineer peter.koonce@gmail.com@pkoonce


![READ [PDF] Joe Kamiya: Thinking Inside the Box](https://cdn7.slideserve.com/12516213/slide1-dt.jpg)