Effective RtI Implementation in Elementary Schools
Response to Intervention (RtI) at the elementary level can take various forms but must encompass three critical components: measurement through universal screening and progress monitoring, tiered instruction, and a problem-solving process. Schools can adapt these elements to fit their specific needs, focusing on strong leadership, shared decision-making culture, and effective data management strategies. Ensuring high-quality core instruction and utilizing evidence-based practices are essential for supporting all learners, particularly those needing interventions at Tier 2 and Tier 3.

Effective RtI Implementation in Elementary Schools
E N D
Presentation Transcript
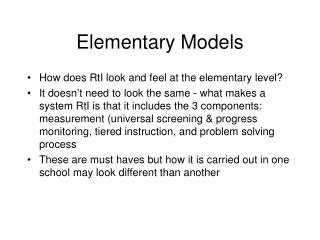
Elementary Models • How does RtI look and feel at the elementary level? • It doesn’t need to look the same - what makes a system RtI is that it includes the 3 components: measurement (universal screening & progress monitoring, tiered instruction, and problem solving process • These are must haves but how it is carried out in one school may look different than another
System Supports • RtI team - Strong leadership • GLT - every 4 to 6 weeks • Master Schedule that includes time for tiered instruction • Culture of shared decision making • Data warehouse
Master Schedule • Creation of a schedule that includes time for tiered instruction may be one of the most supportive things a school can do for it’s staff and students.
Data Warehouse • Purpose - we can’t expect teachers to be shuffling among a bunch of paper with different data on each sheet. We need everything on one sheet if possible to make data analysis easier. • Excel is your basic tool for summarizing data • But there is an array of products for purchase that make data analysis a breeze.
Grade: Target: Goal: Fall Winter Spring Benchmark Benchmark Benchmark Strategic Strategic Strategic Intensive Intensive Intensive Total ____ Enrollment: Barb Scierka, SCRED
Target: 43 72 90 2nd grade Goal 70% Spring Fall Winter Benchmark 45 students 05-06 66% 04-05 61% 03-04 56% Benchmark 47 students 05-06 70% 04-05 69% 03-04 61% Benchmark 05-06 04-05 68% 03-04 54% 42 Isis 30-86 Johanna 35-85 A.S. Marie 31-76 Peggy D 33-73 Peggy N 43-71 Tom T 65-70 Strategic <43, >=26 6 students 9% Strategic 10 students 15% Strategic 2 Bobby 21-67 Woody 16-63 Edward 15-58 Truman 24-57 James 10-53 Intensive <26 17 students 25% Intensive 10 students 15% Intensive 10 Total 68 67 Enrollment: Bollman, Silberglitt Scierka, SCRED
Tiered Instructional Model • Remember - interventions rest on the presumption of a strong core curriculum. • Your data tell you if your core is strong.
High Quality Instruction • This goes back to the evidence base • Are we using known effective practices? • If we aren’t, is there a way to make them better - especially in the core, if can’t purchase a new curriculum, can we beef up the core so that it is better? • When students receive interventions, it’s no longer OK to overlook the quality of the intervention or delivery of the intervention - these are the most important variables!
Integrity of Implementation • Schools psychs can push for the development of fidelity checklists • Can help develop them - but best done as a collaborative effort someone who has expert knowledge of the interention working with someone with expert knowledge of strong instructional principles (you!)
What are Evidence-Based Literacy Practices? • National Reading Panel [2000], Put Reading First [1998], Adams [1990] - a convergence of evidence that these 5 elements must be present - Phonemic awareness - Phonics/word study - Fluency - Vocabulary - Comprehension
Traditional Reading Curricula Designed for average students Intervene late by modifying curricula after students fail Underestimate the specificity of instruction and repetition needed by diverse learners
Redesigned Reading Curricula Designed to meet students’ needs at the 10 - 40th percentile Specificity and repetition are built in It’s easier for teachers to remove elements built into a curriculum [for more able students], than to add them later for struggling students.
Tier 2 compared to Tier 3 Tier 2 is designed for small groups of students who have similar needs Often this is delivered in a ‘standard protocol’ approach - in this approach student needs are predictable, and because most schools have limited resources, they select from a menu of research based intervention curricula to meet a particular need Tier 3, however, becomes more individualized- this doesn’t mean that schools can not use a standard approach, but they may add to it
National Math Panel Executive Summary -some findings: preK-8 curricula should be streamlined and emphasize well-defined critical topics A combination of teacher directed vs. student directed instruction - not one way or the other way Must have conceptual understanding, procedural fluency, and automatic and effortless recall of facts. Research does not support that instruction should be either student centered or teacher directed. Some of each can have a positive impact. Assessment should be improved in quality and emphasize the most critical knowledge and skills leading to Algebra
Math What Works Clearinghouse rated just one elementary math curricula as having potentially positive effects (Everyday Math) The Center for Data-Driven Reform in Education rated 5 curricula, computer assisted instruction &/or instructional strategies as having strong effectiveness
They are: Classwide peer tutoring Missouri Mathematics Program Peer Assisted Learning Strategies Student Teams-Achievement Divisions TAI math
Middle School Math • What Works Clearinghouse rated • I Can Learn Algebra & Prealgebra • Saxon Middle School Math Both as having positive effects, and rated • Cognitive Tutor Algebra 1 • The Expert Mathematician • Univ. of Chicago School Mathematics Project As having potentially positive effects
When students are not being successful • Look at the core curriculum - is it evidence based, does it meet the majority of students’ needs, is it being implemented as intended • Only then do we try Tier 2 - is it evidenced based? Matched to student needs? Implemented with fidelity?
Cautions from George Batsche: • Different skills/content require different time frames for acquisition. • Assessments are more/less sensitive and timelines place artificial expectations on assessment sensitivity and usefulness. • A student response to instruction/intervention (rate) should inform time (and intensity) in instruction/intervention. • Timelines assume all instruction can be delivered with the same impact in the same time, that all assessments can assess change at a uniform rate, and that student data and professional judgment are less important than “how long” a student should get an intervention. • Timelines have the potential to increase the risk that a student remains in an intervention for that particular timeline, even if no evidence exists that the instruction/intervention is working.
One last system support • Professional development for staff should be directly linked to student needs. • The data tell us what our students strengths and weaknesses are. • As educators, we need to focus our own development on what the data indicate students need in terms of instruction instruction
Meeting facilitation - another role for school psychologists • Building RtI team • Grade level teaming
Grade Level Meetings Purpose Grade Level Data Review, Analysis, and Intervention Planning Problem Identification Define Tier Cut-Off Scores & Review Triangle Data Create Updated Intervention Plan for Each Tier Plan Implementation Plan Development Problem Analysis Group Students According to Tiers & Needs Review Resources & Match to Interventions Review Interventions & Match to Students’ Needs Courtesy of D204
Box and Whisker Charts ____________________________________ Student is above the 90 %ile and is well above average. 90th %ile 75th %ile 50th %ile 25th %ile Target 10th %ile
MPS box plot for grade level
Building RtI teams • The problem solving process needs nurturing • You can use agenda or forms to guide the process • Well-oiled teams may not need either after working together and solving problems
Think, Pair, Share What are qualities of good meeting facilitators?
Agendas • See handout
Problem Solving • As a school psych you can be very instrumental in • developing a well-defined problem identification statement • as well as helping teams through problem analysis and generating relevant hypotheses for developing a plan
Let’s do one together • Problem ID - Joe, a 2nd grader is reading 27 cwpm when he is expected to be reading 52 cwpm • Where do we begin in PA?