HNDA Tool Schematic
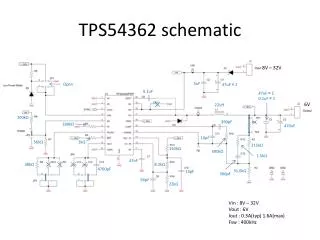
HNDA Tool Schematic. Newly arising households. Buyers. Households who could afford mortgage repayments. PRS. Basic Affordability Calculation. Renters. Households who can’t afford mortgage repayments. Intermediate Rent. Existing Households Needing new supply. Social Rent. Sub-Areas.

HNDA Tool Schematic
E N D
Presentation Transcript
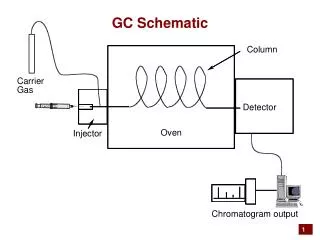
HNDA Tool Schematic Newly arising households Buyers Households who could afford mortgage repayments PRS Basic Affordability Calculation Renters Households who can’t afford mortgage repayments Intermediate Rent Existing Households Needing newsupply Social Rent
Sub-Areas Sum of Sub-Areas constrained to top-level Top-Level Sum of Sub-Areas Sub Areas (May be cross LA boundary but need to be built on datazones)
HNDA Tool Schematic NRS household projections and variants Can vary if required. Affordability calculation splits total requirement between those who could afford mortgage repayments and those who can’t. In terms of existing households, focus on requirement for new buildings (planning output) in terms of transparency. Methodology within Tool(based on update to Waugh model) but may also be entered by users. Choice of feeding into affordability or direct to social need. Layering on of Housing Issues (over/under crowding, condition) Newly arising households Basic Affordability Calculation Existing Households Needing new supply
HNDA Tool Schematic Tool uses a Log-normal distribution to represent prices . Can adjust both the level and spread. Initially based on RoS data. Income can also be adjusted in terms of level and distribution . Initially based on CACI data. Affordability calculation compares point in price distribution to point in income distribution. Based on total price. Default values calibrated to CML data for FtBs. Households who could afford mortgage repayments Households who can’t afford mortgage repayments
HNDA Tool Schematic Buyers determined as % of those who could afford mortgage repayments (to reflect deposit requirements) and can vary over time. Remainder assumed to rent. Rent segmented based on Rent levels (based on RSS data, variable scenarios) and Income. Intermediate rent defined by lower affordability ratio to median rents and higher affordability ratio to 30%ile (LHA) rents. Reflects Housing Benefit support. Social rent below, unassisted PRS above