Download
1 / 51
510 likes | 612 Vues
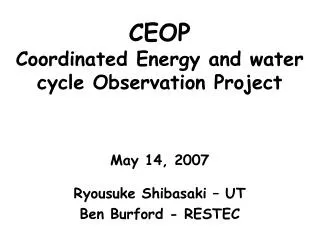
CEOP Coordinated Energy and water cycle Observation Project May 14, 2007 Ryousuke Shibasaki – UT Ben Burford - RESTEC. C oordinated E nergy and water cycle O bservation P eriod. Convergence of Observations A Prototype of the Global Water Cycle Observation System of Systems.

E N D
CEOP Coordinated Energy and water cycle Observation Project May 14, 2007 Ryousuke Shibasaki – UT Ben Burford - RESTEC
Coordinated Energy and water cycle Observation Period Convergence of Observations A Prototype of the Global Water Cycle Observation System of Systems
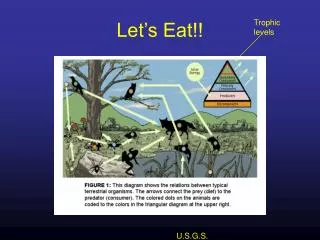
CEOP In-situ Data(In-situ Data from 35 Reference Sites) Four types of CEOP in-situ data • Surface (19 variables) • Tower (9 variables) • Soil (temperature, moisture) • Flux (Sensible Heat, Latent Heat, CO2, Soil Heat Flux) Archived at NOAA NCAR (USA)
CEOP Satellite Data(Satellite data from JAXA, NASA, ESA and Eumetsat) 250 km x 250 km subset scenes, regridded to Lat/Lon grid, centered over the 35 in-situ data sites. Archived at Univ. Tokyo (Japan)
CEOP Model Output Data(10 Major National and Multi-National Centers) NWP – Numerical Weather Prediction data • MOLTS – Model Output Location Time Series (time series at model grid point nearest center of in-situ data sites). • Gridded Model Output – 2D/3D time series. Major National and Multi-National Centers • BoM, CPTEC, ECMWF, ECPC, JMA, DAO, GLDAS, NCEP, NCMRWF, UKMO Archived at the Max Planck Institute (Germany)
D O D S D O D S D O D S CSDIC Archive Satellite (Japan) UCAR Archive In-situ (U.S.) MPI Archive MOLTS, Model Output (Germany) WTF-CEOP JAXA Prototype System (Coordinated Energy and water cycle Observation Project) WTF-CEOP JAXA Prototype System Web Browser Live Access Server (LAS) Ferret
Societal Benefit Areas“Asian Water Cycle Initiative”(Flood forecast)
Reduction of flood risk Warning for evacuation Optimized dam operation Flood warning system Dam operation system Flood forecast Satellite Precipitation data NDVI Land cover data Flood forecasting system (Distributed surface run-off model) In-situ observation data of river flow, River profile data Data assimilation system +Numerical weather Model (regional) +land surface process model +radiative transfer model
D O D S D O D S D O D S CSDIC Archive Satellite (Japan) UCAR Archive In-situ (U.S.) MPI Archive MOLTS, Model Output (Germany) Integrate WMS JAXA Prototype System Web Browser Live Access Server (LAS) Ferret Filter WMS Web Mapping Client