Imperial College Consortium on Pore-Scale Modelling
400 likes | 730 Vues
Imperial College Consortium on Pore-Scale Modelling From pore-space images to multiphase transport predictions Anwar Al-Kharusi, Hassan Behbahani, Branko Bijeljic, Hu Dong, Hiroshi Okabe, Mohammad Piri, Sander Suicmez, Per Valvatne and Martin Blunt

Imperial College Consortium on Pore-Scale Modelling
E N D
Presentation Transcript
Imperial College Consortium on Pore-Scale Modelling From pore-space images to multiphase transport predictions Anwar Al-Kharusi, Hassan Behbahani, Branko Bijeljic, Hu Dong, Hiroshi Okabe, Mohammad Piri, Sander Suicmez, Per Valvatne and Martin Blunt Department of Earth Science and Engineering Imperial College London
Major achievements and where next? • Predictive two- and three-phase pore-scale modelling • Analysis of effects of wettability and trapping in two and three-phase flow – benchmark experiments • Generation of statistical images and networks • Direct simulation on pore-space images: Stokes solver, lattice Boltzmann, level set, smoothed particle hydrodynamics • Statistical analysis of granular packs • Focus on carbonates and carbon storage and links to our own experiments • Fundamentals of wettability • We helped develop pore-to-prediction workflow – now leave to the commercial domain
Solid Contact angles in three-phase flow Bartell-Osterhoff (1927) Water Oil Gas Water 3 Contact angles (O/W,G/W,G/O) 1 Constraint between them 2 Independent values of contact angle Solid Oil Gas Solid Young’s equation
b Oil Water Wettability alteration Oil and water in a triangular pore after primary drainage (oil migration into the reservoir). The areas directly contacted by oil (shown by the bold line) have an altered wettability, while the corners that are water-filled remain water-wet. b is the length of the water-wet surface.
Why ducks don’t get wet Wettability in a three-phase system is defined by the spreading coefficient Cso and the oil/water contact angle qow. If the surface is oil-wet, then Bartell-Osterhoff implies: This means that in a strongly oil-wet system, gas is wetting to water. This is obvious – hydrophobic surfaces are oil-wet. Air Water Oily surface
Multiple phases in a porous medium We have defined wettability and contact angles. There is a pressure difference between two phases at a curved interface – the non-wetting phase is at a higher pressure. Young-Laplace equation: where r1 and r2are the principal radii of curvature.
From rock to network to predictions • Starting point is a voxel image of the rock • Obtained from micro-CT, object-based or statistical methods • From this a representative network of pores and throats is constructed 3 mm
Micro-CT scanning • Direct 3D imaging of a small rock sample • Resolution from 4 – 10 microns • Issues with carbonates over sufficient resolution and heterogeneity • Other groups – ANU, Penn State etc and synchrotron sources (Trieste and Diamond)
Finding a network • Direct simulation on the image works for absolute permeability and drainage capillary pressure. • Network model better for multiphase flow properties • Use maximal ball algorithm (Silin and Patzek) • Other methods – erosion/dilation (ANU, Heriot-Watt, Lindquist)
Residual phase Rock Water Dong, 2007 Non-wetting phase trapping
Carbonates Multiple point statistics Pore network extraction Size: 0.0718mm, image resolution 1.2 μm Extracted network 3D image Coordination number distribution Throat size distribution
Statistical generation of random networks Berea network Equivalent Berea network – can be of arbitrary size
Network building blocks • Network topology is the same as voxel representation • Irregular pore shapes captured through shape factor, G • Both pore bodies and throats are assigned shapes with volumes recorded from voxel image
Simulating displacement - primary drainage • Primary oil migration. Invade accessible elements in order of increasing capillary entry pressure • Invasion through piston-like displacement • Part of elements in contact with oil alters its wettability Altered wettability
Waterflooding • Elements filled in order of reducing capillary entry pressure • Piston-like advance in throats – as in drainage, but advancing contact angles and higher entry pressure due to movement of water onto water layers. Also snap-off.
Three-phase displacements • A generalization of the two-phase displacement events • Assume that a single event only involves two phases • Track target saturation path • Increase gas saturation – choose most favored of gas/oil or gas/water displacement • Double displacement. One phase displaces another, trapped phase, that displaces the third. Most common displacement is gas/oil/water. This mechanism reconnects oil during gas injection after waterflooding.
Gas Configuration B Configuration A Primary Drainage Water Flooding Configuration E Configuration C Gas Injection Layer Collapse Gas Injection Water Oil Configuration I Configuration G Example displacement sequence
Predictive modelling • Single-phase dispersion and NMR response • Two-phase flow predictions – imbibition vs. waterflooding • Three-phase flow predictions • Only a selection of results shown – many more predictions made for non-Newtonian flow, mixed-wet rocks and WAG flooding than we can show here.
Mean flow direction Dispersion Model advective movement in semi-analytic flow field combined with random motion to represent diffusion. Predict amount of dispersion as a function of Peclet number = uL/D
I II III IV 1/(F) d = 1.2 Dispersion Points are experiments and line is prediction. Can physically interpret all the dispersion regimes. s2 = 2Dt.
NMR response – theory, simulation and experiment Sand packs imaged using micro-CT scanning and extracted networks.
Water-wet two-phase predictions • Experimental data from Berea sandstone cores (Oak ‘90) • No tuning of network necessary • The fluids are water and oil • Water-wet data – predictions made with θa = [50°, 80°] Primary drainage Secondary waterflooding Relative permeability Relative permeability
water oil matrix fracture Two displacement processes • Two key displacement processes in porous media: Waterflooding (water injection to displace oil); Counter-current imbibition (water injection in a fractured medium, where water imbibes from fractures and oil escapes).
A paradox? • For a mixed-wet system with a wettability index close to zero: • Waterflooding is very favorable – combination of low Sorand low krw. • But for spontaneous imbibition recovery is poor and very slow – up to 10,000 times slower than a water-wet medium.
A resolution • The very slow imbibition is due to low krw – Sw is low and water is only connected in layers leading to very slow movement (SPE 90132).
Water-wet three-phase data • Water-wet experimental data on Berea cores (Oak ’90) • Gas injection into oil/water • Incorporate double displacement • Few experimental three-phase data sets
Why make predictions? • Validate models. • Aid understanding of pore-scale physics. • Make predictions for cases that are difficult to measure – three-phase flow, different displacement paths and wettability transitions. • Small scale physics does have an impact at the large scale.
At the field scale • Performed a field study on Maureen in the North Sea – wettability trend with initial water saturation. • Representative, fine-scale geological model. 3 km
Recovery curves Much higher recoveries than current state-of-the-art hysteresis models – combination of low residual saturation (mixed-wet and oil layer drainage) and low water relative permeability giving stable flooding (poorly connected water).
170m 170m Z Z Y Y X X 3200m 2280m 3200m 2280m Trapped CO2 saturation Mobile CO2 saturation And it matters for CO2 injection Trapping of CO2 after initial injection period – groundwater flow, water injection or vertical flow (Qi et al., IJGGC, 2009).
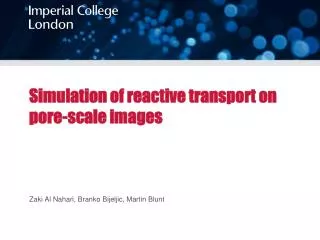
Future directions • Use pore-space images directly. Single-phase Stokes solver: streamlines plus random walk (Peyman) and extensions to reactive transport (Branko).
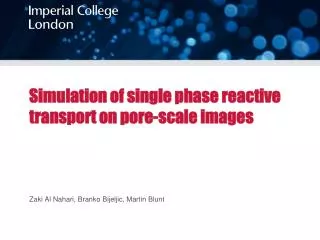
Future directions • Use pore-space images directly for multiphase flow. Picture below look is a lattice Boltzmann simulation – other methods include level set and smoothed particle hydrodynamics (Edo and Ali). Combine with proper wettability characterization based on pore-scale physics.
Future directions • And use direct imaging for pore-by-pore validation and testing of models (Stefan).
Future directions • Entropic characterization of granular media – a more rigorous way to understand the pore space (Rafi).
Conclusions • Have methods to image and reconstruct real rocks and extract networks • Predictions of single phase flow are good – non-Newtonian flow, NMT response and dispersion • Two-phase experimental data are well predicted for a wide range of rocks • Wettability characterisation is not sufficiently well understood • More work is needed to assess impact of pore scale heterogeneity on flow response • Back to basics approach for future work – look at the pore space directly
Thanks to…. • All my post-docs and students • Useful discussions with many colleagues • Sponsors of the research • DTI • EPSRC • ENI • Saudi Aramco • BG • BHP • JOGMEC • Schlumberger • Shell • Statoil • Total