Overview of the Phase Problem
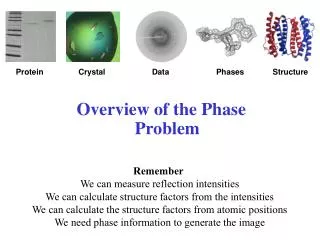
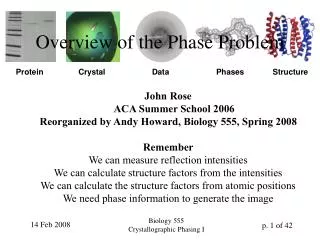
Overview of the Phase Problem. Protein. Crystal. Data. Phases. Structure. John Rose ACA Summer School 2006 Reorganized by Andy Howard, Biology 555, Spring 2008 Remember We can measure reflection intensities We can calculate structure factors from the intensities

Overview of the Phase Problem
E N D
Presentation Transcript
Overview of the Phase Problem Protein Crystal Data Phases Structure John RoseACA Summer School 2006 Reorganized by Andy Howard, Biology 555, Spring 2008 Remember We can measure reflection intensities We can calculate structure factors from the intensities We can calculate the structure factors from atomic positions We need phase information to generate the image Biology 555Crystallographic Phasing I
What is the Phase Problem? X-ray Diffraction Experiment In the X-ray diffraction experiment photons are reflected from the crystal lattice (planes) in different directions giving rise to the diffraction pattern. Using a variety of detectors (film, image plates, CCD area detectors) we can estimate intensities but we lose any information about the relative phase for different reflections. All phase information is lost x,y.z Fhkl [Real Space] [Reciprocal Space]
Phases • Let’s define a phase fj associated with a specific plane [hkl] for an individual atom:fj = 2p(hxj + kyj + lzj) • Atom at xj=0.40, yj=0.05, zj=0.10 for plane [213]:fj = 2p(2*0.40 + 1*0.05 + 3*0.10) = 2p(1.35) • If we examine a 2-dimensional case like k=0, then fj = 2p(hxj + lzj) • Thus for [201] (a two-dimensional case):fj = 2p(2*0.40 + 0*0.05 + 1*0.10) = 2p(0.90) • Now, to understand what this means: Biology 555Crystallographic Phasing I
0° 360° 0 c A A 2p 201 planes B B D D C C 720° 0.4, y, 0.1 E E H H 4p F F G G I I 1080° a 6p 201 Phases fD = 2p[ 2•(0.40) + 1•(0.10)] = 2p(0.) Biology 555Crystallographic Phasing I
In General for Any Atom (x, y, z) a dhkl 6π Remember:We express any position in the cell as (1) fractional coordinates: pxyz = xja+yjb+zjc (2) the sum of integral multiples of the reciprocal axes hkl = ha* + kb* + lc* dhkl 4π Atom (j) at x,y,z dhkl 2π φ 0 c Plane hkl Biology 555Crystallographic Phasing I
Diffraction vector for a Bragg spot • We set up the diffraction vector shkl associated with a specific diffraction direction hkl:shkl = ha* + kb* + lc* • The magnitude of this diffraction vector is the reciprocal of our Bragg-law plane spacing dhkl:|shkl| = 1/ dhkl Biology 555Crystallographic Phasing I
Phase angle for a spot • The phase angle fj associated with our atom is 2p times the projection of the displacement vector pj onto shkl: fj = 2p shkl• pj • But that displacement vector pj is related to the real-space coordinates of the atom at position j:pj = xja + yjb + zjcwhere the fractional coordinates of our atom within the unit cell are(xj, yj, zj) • Thus fj = 2p (ha* + kb* + lc*) • (xja + yjb + zjc) Biology 555Crystallographic Phasing I
Real-space and reciprocal space • But these real-space and reciprocal-space unit cell vectors (a,b,c) and (a*,b*,c*) are duals of one another; that is, they obey: a•a* = 1, a•b* = 0, a•c* =0 b•a* = 0, b•b* = 1, b•c* =0 c•a* = 0, c•b* = 0, c•c* = 1 • … even when the unit cell isn’t all full of 90-degree angles! Biology 555Crystallographic Phasing I
Matrix formulation of this duality • If we construct the 3x3 reciprocal-space unit cell matrix A = (a* b* c*) • And the 3x3 real-space unit cell matrixR = (abc)for a specific position of the sample, then • A and R obey the simple relationshipA = R-1, i.e. AR = I • Where I is a 3x3 identity matrix Biology 555Crystallographic Phasing I
How to use this in getting phases • fj = 2p (ha* + kb* + lc*) • (xja + yjb + zjc) • But using those dual relationships,e.g. a*•a = 1, b*•c = 0, we getfj = 2p (hxj + kyj + lzj) • Note that this is true even if our unit cell angles aren’t 90º! Biology 555Crystallographic Phasing I
Fourier transform Inverse Fourier transform Why Do We Need the Phase? • In order to reconstruct the molecular image (electron density) from its diffraction pattern both the intensity and phase, which can assume any value from 0 to 2, of each of the thousands of measured reflections must be known. Structure Factor Electron Density Biology 555Crystallographic Phasing I
Importance of Phases Hauptman amplitudes with Hauptman phases Karle amplitudes with Karle phases Phases dominate the image! Phase estimates need to be accurate Hauptman amplitudes with Karle phases Karle amplitudes with Hauptman phases Biology 555Crystallographic Phasing I
Understanding the Phase Problem • The phase problem can be best understood from a simple mathematical construct. • The structure factors (Fhkl) are treated in diffraction theory as complex quantities, i.e., they consist of a real part (Ahkl) and an imaginary part (Bhkl). • If the phases, hkl, were available, the values of Ahkl and Bhkl could be calculated from very simple trigonometry: • Ahkl = |Fhkl| cos (hkl) • Bhkl= |Fhkl| sin (hkl) • This leads to the relationship: (Ahkl)2 + (Bhkl)2 = |Fhkl|2 = Ihkl Biology 555Crystallographic Phasing I
Argand Diagram (Ahkl)2 + (Bhkl)2 = |Fhkl|2 = Ihkl The above relationships are often illustrated using an Argand diagram (right). From the Argand diagram, it is obvious that Ahkl and Bhkl may be either positive or negative, depending on the value of the phase angle, hkl. Note: the units of Ahkl, Bhkl and Fhkl are in electrons. Biology 555Crystallographic Phasing I
f0 sinq/l The Structure Factor Atomic scattering factors Here fj is the atomic scattering factor • The scattering factor for each atom type in the structure is evaluated at the correct sinq/l. That value is the scattering ability for that atom. • Remember sinq/l = 1/(2dhkl) • We now have an atomic scattering factor with magnitude f0 and direction fj Biology 555Crystallographic Phasing I
imaginary Resultant Fhkl Individual atom fjs Bhkl real Ahkl The Structure FactorSum of all individual atom contributions Biology 555Crystallographic Phasing I
Electron Density • Remember the electron density (image of the molecule) is the Fourier transform of the structure factor Fhkl. Thus Here V is the volume of the unit cell Biology 555Crystallographic Phasing I
How to calculate r(x,y,z) • In practice, the electron density for one three-dimensional unit cell is calculated by starting at x, y, z = (0, 0, 0) and stepping incrementally along each axis, summing the terms as shown in the equation above for all hkl (as limited by the resolution of the data) at each point in space. Biology 555Crystallographic Phasing I
Solving the Phase Problem • Small molecules • Direct Methods • Patterson Methods • Molecular Replacement • Macromolecules • Multiple Isomorphous Replacement (MIR) • Multi Wavelength Anomalous Dispersion (MAD) • Single Isomorphous Replacement (SIR) • Single Wavelength Anomalous Scattering (SAS) • Molecular Replacement • Direct Methods (special cases) Biology 555Crystallographic Phasing I
Solving the Phase Problem SMALL MOLECULES: • The use of Direct Methods has essentially solved the phase problem for well diffracting small molecule crystals. MACROMOLECULES: • Today, anomalous scattering techniques such as MAD or SAS are the most common techniques used for de novo structure determination of macromolecules. Both techniques require the presence of one or more anomalous scatterers in the crystal. Biology 555Crystallographic Phasing I
Direct methods • Karle, Hauptman, David Sayre, and others determined algebraic relationships among phase angles of groups of reflections. • The simplest are triplet relationships:For three reflectionsh1=(h1,k1,l1), h2=(h2,k2,l2), h3=(h3,k3,l3),they showed that if h3= -h1- h2, then • F1 + F2 + F3 ≈ 0 • Thus if F1 and F2 are known then we can estimate that F3 ≈ -F1 - F2 David Sayre Biology 555Crystallographic Phasing I
When do triplet relations hold? • Note the approximately zero value in that relationship F1 + F2 + F3 ≈ 0. • The stronger the Bragg reflections are, the closer this condition is to being exact. • For very strong Bragg reflections that sum will be very close to zero • For weaker ones it may differ significantly from zero Biology 555Crystallographic Phasing I
Phase probabilities • This notion of relationships among phases obliges us to think of phases probabilistically rather than deterministically. This is a key to the direct-methods approach and has a huge influence on how we think about phase determination. • I’m introducing all of this mostly to get you accustomed to the notion of phase probability distributions! Biology 555Crystallographic Phasing I
Phase probabilities • Any phase has a value between 0 and 2p(or 0 and 360, if we’re using degrees) • If we know it’s close to 2p*0.42, then: • If it’s 2p*(0.42 0.01), it’s a sharp phase probability distribution • If it’s 2p*(0.42 0.32), it’s a much broader phase probability distribution Biology 555Crystallographic Phasing I
Plots of phase probability P() • Integral of probability must be 1, since every phase has to have some value. Sharp distribution Broad distribution 0 2π Biology 555Crystallographic Phasing I
How can we use this? • Obviously if we don’t know f1+f2, we can’t use this to calculate f3, even if the intensities of all three are large. • But we could guess what f1 and f2 are and use this to compute f3. • Then we guess f4 and use the triplet relationship to compute f5 and f6,where h5 = -h1 - h4 and h6 = -h1 - h4 …assuming that reflections 5 and 6 are strong, too! Biology 555Crystallographic Phasing I
Can we make this work? • We start with guessed phases for a 10-100 strong reflections and use the triplet relationships to determine the phases for another 1000 reflections • Any particular calculated phase can be determined by several different triplet relationships, so if they’re self-consistent, the initial guessed 10-100 are correct; if they aren’t self-consistent, the guess was wrong! • In the latter case, we try a different set of guesses for our 10-100 starting phases and keep going Biology 555Crystallographic Phasing I
This actually works, provided: • The data are correctly measured • The data are strong enough that we can pick 1000 strong reflections to use in this process • The data extend to high enough resolution that atomicity (separable atoms) is really found • There are ways to do direct methods without assuming atomicity, but they’re more complicated Biology 555Crystallographic Phasing I
Is this relevant to macromolecules? • Not directly: • Atomicity rarely present • Systematic errors in data • Indirectly yes, because it can be used in conjunction with other methods for locating heavy atoms in the SIR, MIR, and SAS methods • It also helps introduce the notion of phase probability distributions (sneaky!) Biology 555Crystallographic Phasing I
SIR and SAS Methods • Need a heavy atom (lots of electrons) or a anomalous scatterer (large anomalous scattering signal) in the crystal. • SIR - heavy atoms usually soaked in. • SAS - anomalous scatterers usually engineered in as selenomethional labels. Can also be soaked. • SIR collect a native and a derivative data set (2 sets total). SAS collect one highly redundant data set and keep anomalous pairs separate during processing. • SAS - may want to choose a scatterer or wavelength that enhances the anomalous signal. • Must find the heavy atoms or anomalous scatterers • can use Patterson analysis or direct methods. • Must resolve the bimodal ambiguity. • use solvent flattening or similar technique Biology 555Crystallographic Phasing I
What’s the bimodal ambiguity? • As we’ll show next time, a single isomorphous derivative or anomalous scatterer enables us to measure each phase apart from an ambiguity • That is, for each phase we get two answers (e.g. 2π*0.12 and 2π*0.55), and we can’t pick one out • A second scatterer will resolve that Biology 555Crystallographic Phasing I
Phase probabilities with no error P() • A single derivative with no error gives a phase probability like this: 0 2π Biology 555Crystallographic Phasing I
2 derivatives, no error P() Wrong estimate derived from derivative 2 Wrong estimate derived from derivative 1 • The two distributions overlap at the correct answer, not at the wrong answer Correct phase 0 2π Biology 555Crystallographic Phasing I
Errors spread this out • Each phase estimate is not really that sharp • Lack of isomorphism (see below) makes each distribution spread out • Joint probability distribution from 2 or more experiments is the product of the probability distributions of the individual experiments Biology 555Crystallographic Phasing I
Realistic probability distributions P() • Joint probability distribution = product of individual ones 0 2π Biology 555Crystallographic Phasing I
Joint probability distribution Biology 555Crystallographic Phasing I
Heavy Atom Derivatives Heavy atom derivatives MUST be isomorphous • Heavy atom derivatives are generally prepared by soaking crystals in dilute (2 - 20 mM) solutions of heavy atom salts (see Table II below for some examples). • Crystal cracking is generally a good indication that that heavy atom is interacting with the crystal lattice, and suggests that a good derivative can be obtained by soaking the crystal in a more dilute solution. Biology 555Crystallographic Phasing I
Is the derivative worth using? • Once derivative data has been collected, the merging R factor (Rmerge) between the native and derivative data sets can be used to check for heavy atom incorporation and isomorphism. Rmerge values for isomorphous derivatives range from 0.05 to 0.15. Values below 0.05 indicate that there is little heavy atom incorporation. Values above 0.15 indicate a lack of isomorphism between the two crystals. Biology 555Crystallographic Phasing I
What is isomorphism? • Isomorphism for derivatives means that the structure of the derivatized macromolecule is identical to the structure of the underivatized molecule except at the site where the derivative compound has been introduced. Biology 555Crystallographic Phasing I
What is lack of isomorphism? • A derivative may be nonisomorphous if: • It alters the unit cell lengths or angles significantly (>0.2%?) • It rotates or translates the entire macromolecule within the unit cell • It alters significantly the conformation of a large segment (> 8 amino acids or 4 nucleotides?) of the mcromolecule Biology 555Crystallographic Phasing I
Derivative compounds Biology 555Crystallographic Phasing I
Finding the Heavy Atomsor Anomalous Scatterers The Patterson function - a F2 Fourier transform with f = 0 - vector map (u,v,w instead of x,y,z) - maps all inter-atomic vectors - get N2 vectors!!(where N= number of atoms) From Glusker, Lewis and Rossi Biology 555Crystallographic Phasing I