Audio Sampling
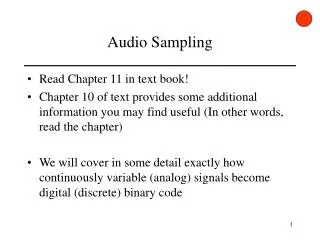
Audio Sampling. Read Chapter 11 in text book! Chapter 10 of text provides some additional information you may find useful (In other words, read the chapter) We will cover in some detail exactly how continuously variable (analog) signals become digital (discrete) binary code. Background.

Audio Sampling
E N D
Presentation Transcript
Audio Sampling • Read Chapter 11 in text book! • Chapter 10 of text provides some additional information you may find useful (In other words, read the chapter) • We will cover in some detail exactly how continuously variable (analog) signals become digital (discrete) binary code
Background • Audio signal (sound) reflects the motion of air particles in space • Microphone converts this motion of air particles into an electrical signal • Audio signals have frequency components that are complex • In simple terms, most audio signals are made up of many different frequencies, combining to make the sound we recognize
Audio Signal • Audio signals have certain characteristics that are well known • Human voice varies from about 100 Hz to 4000 Hz • Piano: The note A above Middle C is 440 Hz • Hertz (Hz) means cycles per second • Sound varies in a manner similar to a Sine Wave • Concert A varies 440 times per second • My voice sounds different than a piano—Why?
Audio Signal Components Concert “A” on a vibraphone
More information • Bandwidth • Is often represented by the highest frequency signal in a sample. But in common usage is used to describe the data rate a channel supports • Can be thought of as the range of frequencies which some transmission medium (air, water, cable, fiber optics) can support • Concert A has a bandwidth of 440 Hz • A human voice has a varying bandwidth— • Recall that the average human’s highest frequency component carrying intelligible information is 3,000 Hz (or 3kHz)—What is the bandwidth?
Period: Signal and Sampling • Take the 440 Hz Concert A—how long is one cycle? • Ts = 1/fs Ts = (1/440) Hz = 0.00227 sec • Also: fs = 1/Ts fs = 1/ 0.00227 sec = 440 Hz • In English: The Time period of one cycle is equal to the inverse of the frequency of the signal in Hz • Problem now is that the Concert A is a continuously variable signal, and we want to digitize it • How often should we sample the signal?
Nyquist’s Theorem • Harry Nyquist, working at Bell Labs developed what has become known as the Nyquist Sampling Theorem: • In order to be perfectly represented by its samples, a signal must be sampled at a sampling rate equal to at least twice its highest frequency component • Or: fs = 2f • Note that fs here is frequency of sampling, not the frequency of the sample
For Example • Take Concert A: 440 Hz • What would be the minimum sampling rate needed to accurately capture this signal? • fs = 2 x 440 Hz = 880 Hz • Take your telephone used for voice, mostly • Highest voice component is: 3000 Hz • Minimum sampling rate: fs = (2 x 3000 Hz) = 6000 Hz • Bell Labs built in some slop real telephone digitization is done at 8000 Hz sampling rate (supporting a 4 kHz bandwidth). Why? Remember that Nyquist said “equal to at least twice…”
Sharp Check • Some of you might be wondering: “The telephone line can support 4 kHz of bandwidth? How can I can use a 56 kbps modem on that line….” • Stay tuned for Shannon’s Law • Modulation schemes
Nyquist’s Revenge • If you grossly oversample (exceed the Nyquist rate), we create more bits to store and to transmit than is necessary to accurately send the signal to the distant end • But, moderate oversampling can work to our advantage, making the system more robust and easier to implement • That’s why Bell Labs decided to sample at 8 kHz vice 6 kHz
Nyquist’s Revenge, Con’t • If you under-sample (sample at less than the Nyquist rate), you run the danger of aliasing • Aliasing is when the signal that you decode is not the signal you encoded • Aliasing is undesirable!
Undersampling—A Very Bad Thing Thanks to: http://euphoria.org/home/help/nyquist.html
Quantization • Read Chapters 12 and 14 in text book! • Chapter 3 of optional text has excellent material that complements the required text • Chapter 10 of text provides some additional information you may find useful (In other words, read the chapter) • We will cover in some detail exactly how continuously variable (analog) signals become digital (discrete) binary code
Quantization • Audio Signals: Continuous in time and amplitude • Digitization of Audio Signals: Must be made discrete in time and amplitude • We’ve learned how to make Continuous signals discrete in Time: Sampling • Don’t forget about Nyquist • To make Continuous signals discrete in Amplitude, we Quantize
What is Quantization? • Quantization establishes a range of values of the continuous function that we “say” can be represented by a particular binary code • Looking at it another way: We round things off • For example: We can say that the continuous temperature range 40.0 to 40.1 degrees F can be represented by one binary code (let’s just say “0110010000”)--The temperature obviously can vary over 40.0 to 40.1 (temp might actually be 40.00987 degrees), but we say that measuring to within a tenth of a degree is OK
Picking the Code • We have a trade-off to make (recurring theme) • Number of bits we want to use versus precision of digitization (What does that mean?) • Recall our Thermometer Engineering Example: • We want to measure -40º F to 140º F (Range =180º F) • We decided to implement an 8 bit code at first • If we use all the bits, what degree of precision do we achieve?
Precision of Quantization • 8 bit code can represent 256 codewords • Our thermometer can measure to: • (Range of Measurement)/Number of Codewords • Or: 180º F/256 Codewords = 0.703º F per codeword • The text on p. 174 uses an example of sampling a voltage that ranges from -10V to +10V • The range measured is over 20V, encoded with 4 bits • Or: 20V/16 Codewords = 1.25V per codeword • For the text example, let’s look at the Quantization Codetable
Problems with Quantization • Some information is lost • Error is introduced (Noise is introduced) • Codetable on p. 174 uses the Range Center as the value of quantization to minimize both effects (Noise and Error)
Problems with Quantization Cont. • Quantization Error: Difference between the actual value of signal and the quantized value • In book example: Say actual voltage value when sampled (a point in time) is +8.5V • Error is: 8.5V - 8.125V = 0.375V • Another example: Actual voltage is +7.75V • Error is 7.75V - 8.125V = -0.375V
Quantizing and Re-Constructing the Signal • Analog-to-Digital Converter (ADC) provides the sampled and quantized binary code • Digital-to-Analog Converter (DAC) converts the quantized binary code back into an approximation of the analog signal by clocking the code to the same sample rate as the ADC conversion • Quantize and Reconstruct the analog signal: Example on the next couple of slides
Things we can do to improve Quantizing performance • Use Companding • Quantization levels are non-uniform • Levels are close where we expect most signals to fall, and farther apart where we expect them less often • Instead of Quantizing entire range, we can quantize just the difference in level from the last sample
Data Rate, Decibels, Signal-to-Noise Ratio, Channel Capacity (Shannon’s Law) • Nyquist is only one element in developing a digital transmission system • Nyquist tells you how often you should sample, but not how much information a channel (a medium through which data moves) can support • Hang on, this one covers a lot of ground!
Logarithm Review • The use of logarithms came about for two basic reasons: • A need to multiply and divide very large numbers • A need to describe specific processes (e.g. in Information Theory) that counted in different bases • The Decimal System can be written as a power of 10 • 100 = 1 • 101 = 10 • 102 = 100 • 103 = 1,000 • 104 = 10,000 See the pattern? The number of zeroes is the same as the value of the exponent
Logarithm Review • Let’s look at these again • 100 = 1 • 101 = 10 • 102 = 100 • 103 = 1,000 • 104 = 10,000 The exponent is called the logarithm of the number :The logarithm of 1 = 0The logarithm of 10 = 1The logarithm of 100 = 2, etc.
Logarithm Review • Question: • We know that log101 = 0 and log1010 = 1. • What if I want the logarithm of a number between 1 and 10? • Answer: • The answer must lie between 0 and 1 • The answer = x, where x is the exponent of 10 We’ll do an example
Logarithm Review • Question • What is the logarithm (base 10) of 3? • Answer: • Write the problem as log103 = x • Transposing, we have 10x = 3 • And 100.4771213 = 3, giving x = 0.4771 • Thus log103 = 0.4771
Logarithm Review • What if I want to take the logarithm of the value “x” with a different base? • Assume you want to have loga of x, i.e. the base is “a” and not 10 • Then loga x =(log10 x) / (log10 a)
Logarithm Review • Let’s look at this another way: • Log2 10 = 3.3219 • Remember, if loga (number) = x • transpose this to ax = (number) • Thus, another way of looking at • Log2 10 = 3.3219 is to write • 23.3219 = 10 Consider a system where the base is 2, and the exponent is always a whole number?
Logarithm Review • 20 = 1 log2 1 = 0 • 21 = 2 log2 2 = 1 • 22 = 4 log2 4 = 2 • 23 = 8 log2 8 = 3 • 24 = 16 log2 16 = 4 • 25 = 32 log2 32 = 5 • 26 = 64 log2 64 = 6 This is the Binary System Log2 is fundamental to Information Theory
Logarithm Review • Note you can go forwards (logarithm) and backwards (anti-logarithm), thus: • If log 10 (number) = x • Then • The anti-logarithm of a (value = x) is given by10x • So the calculator button “log” gives the logarithm (to base 10) and the calculator button “10x” gives the anti-logarithm
Logarithm Review • Standard notations • Any log10 (number) is normally written as log (number) • We normally leave off the base for base 10 • A logarithm that uses e as a base is referred to as a “natural” logarithm, and is written as • loge (number), or ln (number) • All other bases must be included if they are not 10 or e; e.g. log2 (number)
Logarithm Review • So how do logarithms help us? • by converting to logarithms: • Instead of multiplying you can add • Instead of dividing you can subtract • See example on the next slide
Logarithm Review 2 + 3 = 5 • Examples • 100 1,000 = 102 103= 105 • 297 4735 = 102.4728 103.6753 = 106.1481 = 1,406,294.998 • Big Deal! My calculator can do that stuff in zero seconds flat! • logarithms are really an intermediate step to decibels (written as dB)
A Little Background on Data Rate • There is a difference between signal rate and data rate • The unit of measure for signal rate is baud • The unit of measure for data rate is bits per second • The difference? A signal rate is equal to the number of signal events in a period of time. • One bit per signal event--baud rate and bit rate are the same! • More than one bit per signal event--bit rate exceeds baud rate! • Don’t believe me? Let’s go to the next two charts
One Bit per Signal Event Amplitude (V) 1 -- V1 Why aren’t the vertical lines vertical? How many signal events here and here? 0 -- V0 time One signal event--one bit sent per signal event
Signal Events with More than One Bit Amplitude (V) 111 -- V7 110 -- V6 101 -- V5 100 -- V4 011 -- V3 010 -- V2 001 -- V1 000 -- V0 time One signal event--three bits sent per signal event
Channel Noise and Decoding Little noise – decoding with M=8 More noise – results in error The same amount of noise but decoding with M=2
Relating Baud to Data Rate • The signal rate (baud rate) can be related to data rate • We have to know the baud rate (signals per second) • We have to know how many bits are being sent per signal event, then know how many symbols this number of bits can take on • Often called M-ary transmission--more in the modulation lecture • Recall that: • log2 x = (log10 x/log10 2)= 3.32 log10 x • We have to know: D = R log2M bps • Where D is data rate, R is baud rate and M is number possible symbols
For Example • A system signals at 1 baud, 1 bit per signal event (2 symbols per event) D = R log2 M bps --> D = 1 log2 2 = 1 bps • A system signals at 75 baud, 8 bits per signal event (256 possible symbols) D = R log2 M bps --> D = 75 log2 256 = 600 bps • A system signals at 4000 baud, 8 bits per signal event (256 possible symbols) D = R log2 M bps --> D = 4000 log2 256 = 32000 bps • Consider: a semaphore signaler signals at 2 baud (each signal could represent 26 symbols) D = R log2 M bps --> D = 2 log2 26 = 9.4 bps
Decibels • What’s a decibel? • A decibel is one-tenth of a Bel, a unit named for Alexander Graham Bell • In Electronics the decibel (abbreviated as dB) is a logarithmic expression of the ratio between two signal power, voltage, or current levels. • In acoustics, the decibel is used as an absolute indicator of sound power per unit area. • Power. Unit of measurement = watt (W) • dB = 10 log P2/P1 • Voltage or Amperage • dB = 20 log V2/V1 • dB = 20 log A2/A1 Important! Note that dB are log base 10, not base 2!
For Example • You want to express in dB the power relationship between your stereo and the TV (roommate fight) • Stereo has 200W of power, TV has 50W of power • dBW = 10 log 200/50 = 6.02 dB • Stereo wins this battle • Note the other way-- Roomie’s TV has 50W, Stereo 200W • dBW = 10 log 50/200 = -6.02 dB • Roomie’s TV loses the battle
Signal-to-Noise Ratio • S/N is normally measured in dB, as a relationship between the signal you want versus the noise that you don’t but is in the medium (to include your radio…heat causes noise…ever notice that your radio warms up when it is on?) • It can be thought of as a fractional relationship (that is, before you take the log of it): • 1000 W of power v. 20W of noise is either: • 50 (unitless!) • or: about 17 dB ==> 10 log 1000/20 = 16.9897 dB
Shannon’s Law(Shannon’s Limit for Information Capacity) • Claude Shannon at Bell Labs figured out how much information a channel could theoretically carry • C = B log2 (1 + S/N) • Where C is Information Capacity in bps • B is bandwidth in Hz • S/N is Signal-to-Noise ratio • (unitless…don’t make into dB) Note we are back to log base 2!
Shannon’s Law in Action • You have a telephone system with a 3 kHz bandwidth and a S/N ratio of 1000 (very good indeed!) C = B log2 (1 + S/N) = 3000 Hz log2 (1 + 1000) = 29,902 bps (29.9 kbps) • You have a telephone system with a 3 kHz bandwidth and a S/N ratio of 10 (very bad!) C = B log2 (1 + S/N) = 3000 Hz log2 (1 + 10) = 10,378 bps (10.4 kbps)