Image Processing Techniques for Autonomous Robot Navigation
This document presents an overview of the image processing methods employed for the navigation of an autonomous vacuum cleaner, Sir Sux-A-Lot. The primary objective is to optimize the robot’s performance in a simulated environment filled with obstacles. Key concepts include the use of a camera for real-time location identification, background subtraction for object identification, and the implementation of color histogram techniques for effective navigation. This innovative approach enables the robot to systematically cover the area while efficiently picking up rice in the shortest time possible.

Image Processing Techniques for Autonomous Robot Navigation
E N D
Presentation Transcript
Vision processing for robot navigation Autonomous robot vacuum cleaner Nicholas Frank, nicholasfrnk@yahoo.com
Introduction • Explain the image processing used for robot navigation of Sir-Sux-Alot • Image processing overview • Attempted Solution • Final Solution Nicholas Frank, nicholasfrnk@yahoo.com
Problem and solution • The original problem is to pickup the most rice in the least amount of time. • The arena is a simulate room with obstacles. • The best solution is to navigate in a systematic route around the simulated room. Nicholas Frank, nicholasfrnk@yahoo.com
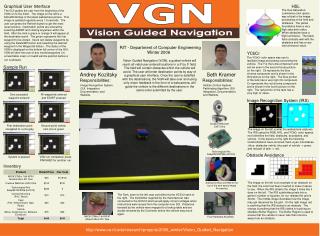
Architecture • A camera above the vacuum arena will identify the location and barring of the robot. • The location and barring are transmitted via UDP to the java navigation engine which tells the robot where to go via serial RF. Nicholas Frank, nicholasfrnk@yahoo.com
Vision Requirements • The goal of this vision system is to find the location and bearing of the robot. • Robustness. This vision system must be able to work in unknown light conditions. Nicholas Frank, nicholasfrnk@yahoo.com
Minimum Data Required • Only two points are necessary. • Identify each point. Connect the points to get the bearing. • Find the mid-point to get center. • Knowing the distance between the points and the relationship to the corners you can calculate the outer dimensions of the robot. Nicholas Frank, nicholasfrnk@yahoo.com
Image • Each pixel is represented using three components (red,green and blue): Alpha=a(x,y); Red=r(x,y); Green=g(x,y);Blue=b(x,y); • Each pixel is a 32-bit number • Each color is 8-bit having a value between 0-255. • F=f(x,y)=(a(x,y),r(x,y),g(x,y),b(x,y)) • The image is represented as a 2-D array [F1,F2,..Fn] • Color representation: Nicholas Frank, nicholasfrnk@yahoo.com
Failed Solution • 2 Ultra bright LEDs: green & red • Background subtraction • Hypothesis: • Using background subtraction everything but the robot should be black. • The LEDs will have a black back ground so only the LEDs should be seen. • The centroid of each LED will be found. • Then the predominate color of each centroid will be found: red or green. Nicholas Frank, nicholasfrnk@yahoo.com
Background subtraction • Capture the first image I1 then subtract it from I2 displaying only the pixels where there is a difference. Then use I2 and subtract it from I3. The general form is In – I(n+1) • Problem 1 (variable pixel colors) : • Pixels of an image change colors when nothing changes. • Solution 1a: Take the max or min of the background image pixels then subtract from the average image. • Solution 1a produces it own problems. Any change in the camera position or lighting will invalidate the background causing most of the image to be displayed. (Demo background subtraction) • Problem 2 (Halo effect) : • The change in the image is such a distortion of the surrounding pixels that the image gets a halo around the change. Nicholas Frank, nicholasfrnk@yahoo.com
Chosen Solution • Find object with 3 dots • Original web cam image • Blend image into background using web cam settings. • Using a color histogram threshold the image to Black and white • Use a recursive flood fill algorithm to find blobs. The north,south,west and east values of the blobs. Then count the holes in the blobs. The robot will only have 3 holes. • Once the holes are identified it is possible to use there relationship to each other to figure out barring. Nicholas Frank, nicholasfrnk@yahoo.com
Color Histogram • As mention earlier each pixel’s color is represented by an 8-bit value of red, green and blue. That value is between 0 and 255. • The color histograms graph represents: • Y axis: the number of times a color is used. • X axis: the color represented. • The graphs are: • All color representations combined • Red,green and blue only Nicholas Frank, nicholasfrnk@yahoo.com
Threshold with Color Histogram • The color histogram is used as a threshold to map the image to black and white. • You may have already noticed two distinct humps in the graph. • The left hump and bigger hump is the background • The right hump is everything more rich in color then the background • The threshold bars set between the two humps produce the image to the right • A dynamic threshold looks for the end of the first hump. This made the vision system resistant to changing light conditions such as flash photography. Nicholas Frank, nicholasfrnk@yahoo.com
Flood Fill • What is Flood Fill? • Technique to fill the closed area with an interior color to be replaced by fill color. Nicholas Frank, nicholasfrnk@yahoo.com
Flood Fill Algorithm • Fast recursive flood-fill Algorithm • public void fillFast(int x, int y, int fill) { if ((x < 0) || (x >= raster.width)) return; if ((y < 0) || (y >= raster.height)) return; int old = raster.getPixel(x, y); if (old == fill) return; raster.setPixel(fill, x, y); fillEast(x+1, y, fill, old); fillSouth(x, y+1, fill, old); fillWest(x-1, y, fill, old); fillNorth(x, y-1, fill, old); } • private void fillEast(int x, int y, int fill, int old) { // now it only checks for one direction. if (x >= raster.width) return; if (raster.getPixel(x, y) == old) { raster.setPixel(fill, x, y); // only three direction of recursion. fillEast(x+1, y, fill, old); fillSouth(x, y+1, fill, old); fillNorth(x, y-1, fill, old); } } Nicholas Frank, nicholasfrnk@yahoo.com
How flood fill was used • Once a blob was found it got flood filled. • The most north,south,west and east points were recorded during the flood fill. These points are represented with the white dots. • The max points were used to calculate the center which is represented by a white dot. • The blob was next scanned for holes which were then flood filled to calculate there center points. • If a blob had three holes it was identified as the robot. • All other blobs were ignored. Nicholas Frank, nicholasfrnk@yahoo.com
Acknowledgements • Flood-Fill Algorithm, By Junichi Edamitsu • http://research.microsoft.com/vision/ • http://research.microsoft.com/projects/VisSDK/ • P.F. Whelan and D. Molloy (2000), Machine Vision Algorithms in Java: Techniques and Implementation, Springer (London), 298 Pages. ISBN 1-85233-218-2. Nicholas Frank, nicholasfrnk@yahoo.com