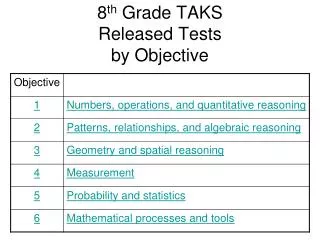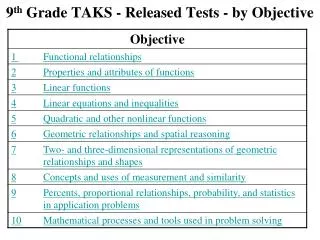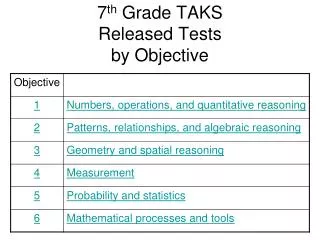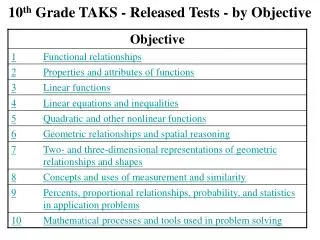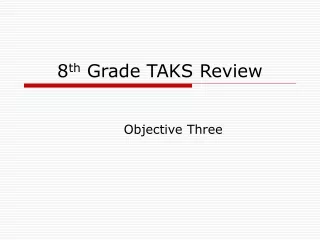
11 th Grade TAKS - Released Tests - by Objective
5.3k likes | 6.05k Vues
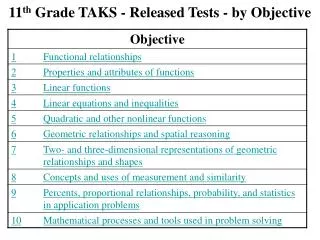
11 th Grade TAKS - Released Tests - by Objective. Objective 1: The student will describe functional relationships in a variety of ways.

11 th Grade TAKS - Released Tests - by Objective
E N D
Presentation Transcript
Objective 1:The student will describe functional relationships in a variety of ways.
A(b)(1) Foundations for functions. The student understands that a function represents a dependence of one quantity on another and can be described in a variety of ways.(A) The student describes independent and dependent quantities in functional relationships.
An ice-cream vendor made a table showing the relationship between the daily high temperature and the number of ice-cream cones sold per day. What is the dependent quantity in this relationship? A The daily high temperature B The number of ice-cream cones sold per day C All of the data in the table D Cannot be determined Correct Answer - B April 2006 #13
The volume of a sphere can be found by using the function V = πr3, where V represents the volume and r represents the radius. What is the dependent quantity in this function? Aπ BV Cr D Correct Answer - B Fall 2005 #35
A community-service organization is selling $10 tickets to a fund-raiser for the local children’s hospital. The money raised from ticket sales will be donated to the children’s hospital. Which best describes the dependent quantity in this situation? F The number of tickets sold is dependent on the amount of the donation. G The price of each ticket is dependent on the number of tickets sold. H The amount of the donation is dependent on the number of tickets sold. J The price of each ticket is dependent on the amount of the donation. Correct Answer - H October 2005 #36
A department store had a 20%-off sale on all clothing items. Which statement best represents the functional relationship between the sale price of an article of clothing and the original price? A The original price is dependent on the sale price. B The sale price is dependent on the original price. C The sale price and the original price are independent of each other. D The relationship cannot be determined. Correct Answer - B April 2004 #55
A(b)(1) Foundations for functions. The student understands that a function represents a dependence of one quantity on another and can be described in a variety of ways.(B) The student [gathers and records data, or] uses data sets, to determine functional (systematic) relationships between quantities.
The table below shows the relationship between x and y. Which function best represents the relationship between the quantities in the table? Fy = 2x + 1 Gy = 2x3 + 1 Hy = 2x2 – 3 Jy = 2x2 + 4x + 1 Correct Answer - G July 2006 #56
Casey conducted an experiment and recorded the data in the table shown below. Which equation best describes these data? Fy = x Gy = 2x – 1 Hy = x2 + x – 1 Jy = (x – 1)2 + 1 Correct Answer - J April 2006 #40
Which of the following sets does not represent a function? F {(-1, -1), (1, 1), (2, 2), (3, 3), (4, 4)} G {(-1, 0), (0, 2), (1, 4), (2, 6), (3, 8)} H {(-1, 2), (1, 1), (1, -1), (2, 1), (4, 2)} J {(-2, 4), (-1, 1), (1, 1), (2, 4), (3, 9)} Correct Answer - H February 2006 #44
Which of the following equations best represents the relationship in the set of data shown below? Correct Answer - D February 2006 #57
The table below shows h, the approximate height of an Ameri-Willow tree after t years. Which equation best fits these data? Fh = 8.2 + 3.75t Gh = 1.12 + 7.82t Hh = 7.5 + 0.65t2 Jh = -1.24 + 9.75t Correct Answer - G Fall 2005 #10
Which of the following graphs does not represent y as a function of x? Correct Answer - C October 2005 #19
Which equation best describes the relationship between x and y shown in the table below? Ay = 3x Bx = 3y Cx = 3y2 Dy = 3x2 Correct Answer - D April 2004 #31
A consumer group measured an automobile’s acceleration by using the data shown below. Which equation best represents the relationship between d, the automobile’s distance from the starting line, and t, the time? Ad = 10.5t2 Bd = 10.5t3 Cd = 5.25t Dd = 5.25t2 Correct Answer - D July 2004 #13
An equation can be used to find the total cost of buying square-foot floor tiles to cover an area of floor. Using the table below, find the equation that best represents y, the total cost, as a function of x, the number of square feet to be covered. Fx = 0.35y Gy = 0.35x Hx = 2.86y Jy = 2.86x Correct Answer - G Spring 2003 #28
The table shows the number of slices of pepperoni placed on each size of pizza at Pepe’s Pizza Shop. Let r represent the radius of the pizza and let n represent the number of slices of pepperoni. Identify the equation that best represents the relationship between the radius and the number of slices of pepperoni. Ar = 2n + 1 Bn = 2r + 1 Cr = n2 + 1 Dn = r2 + 1 Correct Answer - D Spring 2003 #45
A(b)(1) Foundations for functions. The student understands that a function represents a dependence of one quantity on another and can be described in a variety of ways.(C) The student describes functional relationships for given problem situations and writes equations or inequalities to answer questions arising from the situations.
The initial pressure inside a closed container is 200 pounds per square inch (psi). As the temperature inside the container increases, the pressure increases. If the pressure increases 7.5 psi for each degree Fahrenheit of increased temperature, which equation best represents p, the pressure inside the container after the temperature has increased t degrees? Fp = 7.5t Gp = 200 + 7.5t Hp = 200t + 7.5 Jp = 200t + 7.5t Correct Answer - G July 2006 #14
Mitesh is m years old, and his brother Hiren is h years old. Which statement best describes the inequality m≥ h + 3? A Mitesh is at least 3 times as old as Hiren. B Mitesh is at least 3 years older than Hiren. C Hiren is more than 3 years older than Mitesh. D Hiren is more than 3 times as old as Mitesh. Correct Answer - B July 2006 #37
The profit earned on the sale of tool sets can be represented as the product of the number of tool sets sold and the difference between the selling price and the cost of making each set. The selling price of each tool set is $19.95, and the cost of making each set is $4.37. Which equation represents p, the profit, in terms of s, the number of tool sets sold? Ap = s(19.95 – 4.37) Bp = s(19.95 + 4.37) Cp = 19.95 + 4.37s Dp = 19.95s – 4.37 Correct Answer - A April 2006 #37
The wheels on Lee’s bike each have a circumference of approximately 7 feet. Which of the following equations could be used to determine y, the total distance traveled in feet for each wheel as a function of x, the number of wheel revolutions? Correct Answer - H February 2006 #48
The runners on a cross-country team need to buy bottles of water for their next meet. Each runner will buy at least four bottles, and the coach will buy six extra bottles. Which inequality best describes the total number of bottles, b, the runners and coach will buy in terms of n, the number of runners on the team? Ab < 4n + 6 Bb≥ 6n + 4 Cb≥ 4n + 6 Db < 6n + 4 Correct Answer - C Fall 2005 #19
Luxury Limousine charges a fee of $50 per hour to rent a limousine plus $0.15 per mile driven. Which equation can be used to determine c, the total cost to rent a limousine for 3 hours, if m represents the number of miles the limousine is driven? Ac = 50 + 0.15m Bc = 50 + 0.45m Cc = 150 + 0.45m Dc = 150 + 0.15m Correct Answer - D October 2005 #49
An artist studies human proportions in order to make realistic drawings. He observes that a person’s kneeling height, y, is ¾ of the person’s standing height, x. Which equation best represents this relationship? Ay = ¾x By = -¾x Cy = x – ¾ Dy = x + ¾ Correct Answer - A April 2004 #1
At the beginning of the school year, teachers had 240,000 sheets of copier paper to use. If about 2000 sheets of paper are used each day during a school year, which equation best describes s, the number of sheets that are left after d days of school? As = 240,000 – 2000d Bs = 240,000 + 2000d Cs = 240,000d – 2000d Ds = 240,000d + 2000d Correct Answer - A July 2004 #1
The Texas Pecan Company ships pecans in wooden boxes. An empty wooden box has a mass of 2.5 kilograms. The pecans have an average mass of 0.015 kilograms each. Which equation expresses m, the total mass of a box of pecans, in terms of p, the number of pecans in the box? Fm = 0.015p + 2.5 Gm = 0.015p – 2.5 Hm = 0.015 – 2.5p Jm = 0.015 + 2.5p Correct Answer - F July 2004 #46
Eddie’s Towing Company charges $40 to hook a vehicle to the tow truck and $1.70 for each mile the vehicle is towed. Which equation best represents the relationship between the number of miles towed, m, and the total charges, c? Ac = 40 + 1.70 Bc = 40 + 1.70m Cc = 40m + 1.70m Dc = 40m + 1.70 Correct Answer - B Spring 2003 #11
A(b)(1) Foundations for functions. The student understands that a function represents a dependence of one quantity on another and can be described in a variety of ways.(D) The student represents relationships among quantities using [concrete] models, tables, graphs, diagrams, verbal descriptions, equations, and inequalities.
Which quadratic equation best represents the parabola shown below? Ay = x2 + x + 5 By = x2 + 5 Cy = -x2 + 5 Dy = -x2 + x + 5 Correct Answer - C July 2006 #17
Which graph best represents the relationship shown in the table below? Correct Answer - G April 2006 #54
Which equation best represents the graph below? Correct Answer - F February 2006 #40
Which graph best represents the equation y = 2x2 + 1? Correct Answer - D Fall 2005 #57
Which inequality does the graph shown below best represent? Correct Answer - B October 2005 #9
Which graph best represents the inequality x + 2y≤ –14? Correct Answer - H April 2004 #20
The graph is the solution for which inequality? Correct Answer - F July 2004 #54
Which graph best represents all the pairs of numbers (x, y) such that x + y < –6? Correct Answer - G Spring 2003 #50
A(b)(1) Foundations for functions. The student understands that a function represents a dependence of one quantity on another and can be described in a variety of ways.(E) The student interprets and makes inferences from functional relationships.
The graph below shows the number of light bulbs in thousands that the Electric Lightbulb Company sold from 1998 to 2001. If the trend shown on the graph continues, in what year can the Electric Lightbulb Company first expect to sell more than 1.3 million light bulbs? A 2010 B 2008 C 2009 D 2011 Correct Answer C July 2006 #25
According to the data shown below, which would be the best prediction of the number of passengers at the International Jetport for the year 2008? A 70.1 million B 68.5 million C 74.8 million D 78.0 million Correct Answer - C April 2006 #59
The total cost, c, of leasing a car can be expressed by the equation c = 1800 + 185m, where m is the number of months the car is leased. Which statement is true based on the information given? F The car must be leased for at least 60 months. G The total cost of leasing this car for 1 year is more than $4000. H The total cost of leasing this car for 2 years is $4020. J The cost of leasing this car is greater than the cost of buying one. Correct Answer - G February 2006 #12
The payroll clerk at an appliance store calculates each salesclerk’s weekly salary using the function f(x) = 75 + 0.10x, where x is each salesclerk’s total weekly sales. The best interpretation of this situation is that each salesclerk is paid – F $75 plus a 10% commission on the total weekly sales of all the salesclerks G $75 plus a 10% commission on his or her weekly sales H $75 plus a 10% commission on the total weekly profit for the store J the same amount regardless of his or her total weekly sales Correct Answer - G Fall 2005 #14
The owner of a candle store purchases his candles from a local distributor. The graph below shows the relationship between n, the number of candles ordered, and c, the total cost of the candle order. Which conclusion can be drawn about this relationship? A An order of 50 candles will cost less than $20. B An order of 100 candles will cost more than $60. C An order of 150 candles will cost less than $70. D An order of 200 candles will cost more than $90. Correct Answer - D October 2005 #11
Karen jogs at a steady pace up a hill in her neighborhood. She then runs down the hill, and her speed increases. Which graph best describes this situation? Correct Answer - D April 2004 #3
The net profit, p, that a company makes from the production of widgets is represented by the equation p = 2.5n – 25,000, where n is the number of widgets the company sells. Which is the best interpretation of this information? A The company has made a profit of $25,000. B The company needs to sell more than 10,000 widgets before it makes a profit. C The company’s profit needs to be more than $25,000. D The company has sold more than 10,000 of its widgets. Correct Answer - B July 2004 #29
Gina did a research project on how age affects sleep patterns. She concluded that as people age, they sleep fewer hours until a point in adulthood when the number of hours remains constant. Gina also found that after the age of 70 the amount of time spent sleeping increases slightly. Which graph best shows the results of Gina’s research? Correct Answer - A Spring 2003 #59
Objective 2:The student will demonstrate an understanding of the properties and attributes of functions.
A(b)(2) Foundations for functions. The student uses the properties and attributes of functions.(A) The student identifies [and sketches] the general forms of linear (y = x) and quadratic (y = x2) parent functions.
Which equation is the parent function of a quadratic equation? Ay = √x By = x Cy = │x│ Dy = x2 Correct Answer - D April 2006 #57