Download

1 / 13
130 likes | 146 Vues
Explore the history and patterns of human population growth, including the impact of food scarcity, disease, and the Industrial Revolution. Learn about demography, demographic transition, age structure, and predictions for future population growth.

E N D
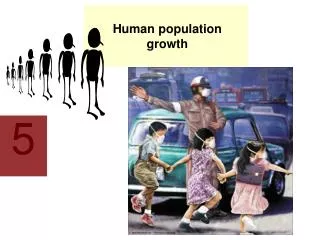
Human Population Growth Chapter 5-3
History 1. Human population is increasing with time (like many other organisms). 2. About 11,000 years of human existence- population growth was slow. Reasons: a. Food was scarce b. Disease c. ½ the children survived to adulthood
3. Industrial Revolution changed human growth rate/longevity. a. Food was more plentiful b. Improved sanitation, medicine, nutrition
B. Patterns of Population Growth 1. Demography- study of human populations a. examines characteristics of human populations b. explains how populations change over time 2. Birthrate, death rate, and age structure of a population help predict why some countries have high growth rates while other countries grow more slowly
Figure 5-12 Draw on back of notes 3. Demographic Transition- a dramatic change in birth and death rate a. Birthrates/deathrates- high Deathrates drop/birthrate remains high. Birthrate then drops b. Has occurred in U.S., Europe and Japan- rest of the world still growing
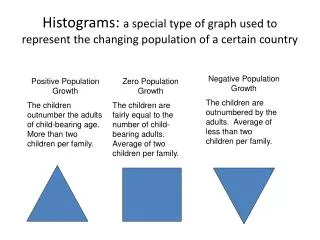
4. Age-Structure Diagram- Population profile a. Graphs of number of people in different age groups b. Shows percentages of males and females in the populations
C. Future Population Growth 1. Predicts how the world population will grow 2. Must consider a. age-structure b. prevalence of disease 3. Current projections-that by 2050 population may reach 9-12 billion.