Download
1 / 77
820 likes | 1.2k Vues
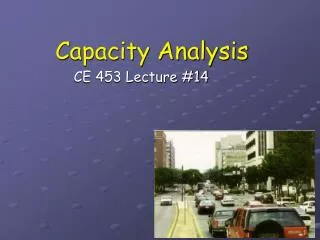
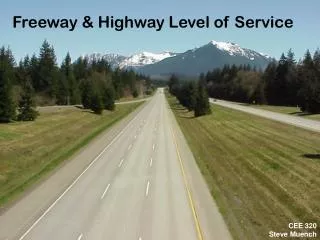
Freeway & Highway Level of Service. CEE 320 Steve Muench. Outline. Definitions Level of Service (LOS) Freeway Segment LOS Determination Free-flow speed Flow Rate Multilane Highway LOS Design Traffic Volume. I-5 Average Daily Traffic. from the WSDOT 2001 Annual Traffic Report.

E N D
Freeway & Highway Level of Service CEE 320Steve Muench
Outline • Definitions • Level of Service (LOS) • Freeway Segment LOS Determination • Free-flow speed • Flow Rate • Multilane Highway LOS • Design Traffic Volume
I-5 Average Daily Traffic from the WSDOT 2001 Annual Traffic Report
Freeway Defined • A divided highway with full control of access and two or more lanes for the exclusive use of traffic in each direction. • Assumptions • No interaction with adjacent facilities (streets, other freeways) • Free-flow conditions exist on either side of the facility being analyzed • Outside the influence or ramps and weaving areas
Basic Freeway Segment From Highway Capacity Manual, 2000
Definitions • Freeway Capacity • The maximum sustained 15-min flow rate, expressed in passenger cars per hour per lane, that can be accommodated by a uniform freeway segment under prevailing traffic and roadway conditions in one direction of flow.
Definitions – Flow Characteristics • Undersaturated • Traffic flow that is unaffected by upstream or downstream conditions. • Queue discharge • Traffic flow that has just passed through a bottleneck and is accelerating back to the FFS of the freeway. • Oversaturated • Traffic flow that is influencedby the effects of a downstream bottleneck. From Highway Capacity Manual, 2000
Speed vs. Flow SfFree Flow Speed Uncongested Flow Sm Speed (mph) Optimal flow, capacity, vm Congested Flow Flow (veh/hr)
Uncongested Flow From Highway Capacity Manual, 2000
Definitions – Free-Flow Speed • Free-Flow Speed (FFS) • The mean speed of passenger cars that can be accommodated under low to moderate flow rates on a uniform freeway segment under prevailing roadway and traffic conditions. • Factors affecting free-flow speed • Lane width • Lateral clearance • Number of lanes • Interchange density • Geometric design
Definitions • Passenger car equivalents • Trucks and RVs behave differently • Baseline is a freeway with all passenger cars • Traffic is expressed in passenger cars per lane per hour (pc/ln/hr or pcplph) • Driver population • Non-commuters suck more at driving • They may affect capacity • Capacity • Corresponds to LOS E and v/c = 1.0
Definitions – Level of Service (LOS) • Chief measure of “quality of service” • Describes operational conditions within a traffic stream. • Does not include safety • Different measures for different facilities • Six measures (A through F) • Freeway LOS • Based on traffic density
LOS A Free-flow operation LOS B Reasonably free flow Ability to maneuver is only slightly restricted Effects of minor incidents still easily absorbed Levels of Service From Highway Capacity Manual, 2000
LOS C Speeds at or near FFS Freedom to maneuver is noticeably restricted Queues may form behind any significant blockage. LOS D Speeds decline slightly with increasing flows Density increases more quickly Freedom to maneuver is more noticeably limited Minor incidents create queuing Levels of Service From Highway Capacity Manual, 2000
LOS E Operation near or at capacity No usable gaps in the traffic stream Operations extremely volatile Any disruption causes queuing LOS F Breakdown in flow Queues form behind breakdown points Demand > capacity Levels of Service From Highway Capacity Manual, 2000
Freeway LOS LOS Calculation • Does not consider • Special lanes reserved for a particular type of vehicle (HOV, truck, climbing, etc.) • Extended bridge and tunnel segments • Segments near a toll plaza • Facilities with FFS < 55 mi/h or > 75 mi/h • Demand conditions in excess of capacity • Influence of downstream blockages or queuing • Posted speed limit • Extent of police enforcement • Intelligent transportation system features • Capacity-enhancing effects of ramp metering
Freeway LOS Input Geometric Data Measured FFS or BFFS Volume BFFS Input BFFS Adjustment Lane width Number of lanes Interchange density Lateral clearance Volume Adjustment PHF Number of lanes Driver population Heavy vehicles Measured FFS Input Compute FFS Compute flow rate Define speed-flow curve Compute density using flow rate and speed Determine speed using speed-flow curve Determine LOS
Freeway LOS LOS Criteria for Basic Freeway Segments From Highway Capacity Manual, 2000
Freeway LOS Determining FFS • Measure FFS in the field • Low to moderate traffic conditions • Use a baseline and adjust it (BFFS)
Freeway LOS Lane Width Adjustment (fLW) • Base condition (fLW = 0) • Average width of 12 ft. or wider across all lanes From Highway Capacity Manual, 2000
Freeway LOS Lateral Clearance Adjustment (fLC) • Base condition (fLC = 0) • 6 ft. or greater on right side • 2 ft. or greater on the median or left side From Highway Capacity Manual, 2000
Freeway LOS Number of Lanes Adjustment (fN) • Base condition (fN = 0) • 5 or more lanes in one direction • Do not include HOV lanes • fN = 0 for all rural freeway segments From Highway Capacity Manual, 2000
Freeway LOS Interchange Density Adjustment (fIC) • Base condition (fIC = 0) • 0.5 interchanges per mile (2-mile spacing) • Interchange defined as having at least one on-ramp • Determined over 6-mile segment From Highway Capacity Manual, 2000
Freeway LOS Determining Flow Rate • Adjust hourly volumes to get pc/ln/hr
Freeway LOS Peak Hour Factor (PHF) • Typical values • 0.80 to 0.95 • Lower PHF characteristic or rural or off-peak • Higher PHF typical of urban peak-hour
Freeway LOS Heavy Vehicle Adjustment (fHV) • Base condition (fHV = 1.0) • No heavy vehicles • Heavy vehicle = trucks, buses, RVs • Two-step process • Determine passenger-car equivalents (ET) • Determine fHV
Freeway LOS Passenger-Car Equivalents (ET) • Extended segments method • Determine the type of terrain and select ET • No one grade of 3% or more is longer than 0.25 miles OR • No one grade of less than 3% is longer than 0.5 miles From Highway Capacity Manual, 2000
Freeway LOS Passenger-Car Equivalents (ET) • Specific grades method • Any grade of 3% or more that is longer than 0.25 miles OR • Any grade of less than 3% that is longer than 0.5 miles From Highway Capacity Manual, 2000
Freeway LOS From Highway Capacity Manual, 2000
Freeway LOS Passenger-Car Equivalents (ET)
Freeway LOS Passenger-Car Equivalents (ET) • Composite grades method • Determines the effect of a series of steep grades in succession • Method OK if… • All subsection grades are less than 4% OR • Total length of composite grade is less than 4000 ft. • Otherwise, use a detailed technique in the Highway Capacity Manual (HCM) From Highway Capacity Manual, 2000
Freeway LOS Determine fHV
Freeway LOS Driver Population Adjustment (fP) • Base condition (fP = 1.0) • Most drivers are familiar with the route • Commuter drivers • Typical values between 0.85 and 1.00 • Two-step process • Determine passenger-car equivalents (ET) • Determine fHV
Freeway LOS Define Speed-Flow Curve Select a Speed-Flow curve based on FFS From Highway Capacity Manual, 2000
Freeway LOS Determine Average PC Speed (S) Use vp and FFS curve to find average passenger car speed (S) From Highway Capacity Manual, 2000
Freeway LOS Determine Average PC Speed (S) For 70 < FFS ≤ 75 mph AND (3400 – 30FFS) < vp ≤ 2400 For 55 < FFS ≤ 70 mph AND (3400 – 30FFS) < vp ≤ (1700 + 10FFS) For 55 < FFS ≤ 75 mph AND vp < (3400 – 30FFS)
Freeway LOS Determine Density • Calculate density using:
Freeway LOS DetermineLOS LOS Criteria for Basic Freeway Segments From Highway Capacity Manual, 2000
Geometry 11 ft. lane width Left lateral clearance = 5 ft. Right lateral clearance = 4 ft. Other 7 am PHF = 0.95 10 pm PHF = 0.99 2% trucks 3% buses Freeway LOS Example Determine the typical LOS for SR 520 eastbound near Microsoft (MP 10.25 – shown in the picture below) at 7 a.m. and 10 p.m. from WSDOT’s SRWebhttp://srview.wsdot.wa.gov/
Freeway LOS Determine FFS
Freeway LOS Determine FFS
Freeway LOS Determine FFS from Microsoft MapPoint In a 6-mile stretch from I-405 to Redmond there are 5 interchanges
Freeway LOS Determine FFS
Freeway LOS Determine Flow Rate (vp) At 7am the ½ hour volume is about 4000 veh/hrAt 10 pm the ½ hour volume is about 1700 veh/hr Graph from the Puget Sound Regional Council’s Puget Sound Trends, No. T6, July 1997
Freeway LOS Determine Flow Rate (vp)
Freeway LOS Determine LOS
Freeway LOS LOS Criteria for Basic Freeway Segments From Highway Capacity Manual, 2000
Multilane Highway LOS Multilane Highway LOS • Similar to Freeway LOS • A few minor differences