
Averages and Sampling for Journalistic Hygiene
E N D
Presentation Transcript
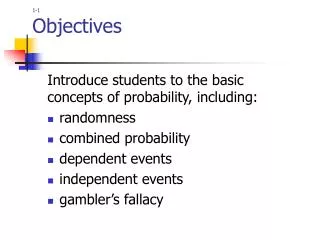
5-1Objectives • Review concepts of averages • Introduce the concept of sampling • Promote number sense • Encourage “journalistic hygiene”
5-2Journalistic Hygiene • An attitude and practice of healthy skepticism, innate curiosity, and thorough analysis of a situation • An integral component of a scientific mind
5-3Thinking about the “average” Mean: Arithmetic average • Add numbers you are averaging and divide by the number of values Median: Halfway point • Equal percentage of numbers are above and below the median Mode: Number that occurs the most frequently in a set of numbers
5-4For a mean of 100, there are many possible distributions All the values between 95 and 105 Half of the values are around 50 and the other half are around 150 A fourth of the values are 0, half are near 50, the other fourth are around 300 Can you think of another distribution?
5-5Dinner Party • 5 guests are invited to dinner by a couple • The guest’s ages are 89. 92, 17, 2, and 2 • The butler, DJ, and the cook each determine the average age of the guests • The outcome: Everyone is treated to strained peas, accompanied by the latest CD from the Cranberries, followed by a fine cognac What happened???
5-6Dinner Party: Thinking about averages The butler used the mean (89 + 92 + 17 + 2 + 2 = 202; 202 5 = 40.4) • The DJ used the median17 is the number right in the middle • The cook used the mode2 is the most frequent number
5-7Sampling How scientists select the subjects who participate in a scientific study • If all subjects in a group are selected, the selection is called a census • If a percentage of the group is selected, the selection is called a sample
5-8Questions to ask about a sample • Who is included? • Who is not included? • How was the sample selected? • Probability sample • random sample • Non-probability sample • convenience sample • consecutive sample • What are the characteristics of the selected group?
5-9Thinking About Statistics Fact reported in newspaper: • The average Harvard graduate from the class of 1990 makes $600,000/yr. What were your first thoughts when you read this fact? What factors might make this figure inaccurate?
5-10Number Sense • It takes 11-1/2 days for a million seconds to pass • It takes almost 32 years for a billion seconds to pass • It takes over 317 centuries for a trillion seconds to pass
5-11Time Flies • Statistically each cigarette robs a regular smoker of 5.5 minutes of life • A teenager who smokes will smoke for an average of 25 years • Teenage smokers smoke about 0.6 packs a day
5-12Class Height:Mean, Median, and Mode • Develop a simple data chart to record data • Choose a representative sample • Interview respondents • Record data • Calculate mean • Calculate median • Calculate mode • Report findings Hint: To simplify the calculation of the mean, convert your heights from feet and inches to all inches (1 foot = 12 inches)
5-13Olympic Game:100 Yard Dash • Florence Joyner Griffith and “Fleetfoot” competing • Joyner’s past times were 11.08, 10.81, 10.75, 10.62, and 10.49 • Find Joyner’s average time • Fleetfoot’s times were 11.51, 11.25, and 11.89 • Find Fleetfoot’s average time • These two women were the only U.S. runners to make it to the final race • What was the average (mean) time for the U.S. team?
5-14Olympic Game:100 Yard Dash RIGHT WRONG 11.08 + 10.81 + 10.75 + 10.62 + 10.75 + 11.55 = 10.49 + 11.51 + 22.3 11.25 + 11.89 = 22.3 ÷ 2 = 11.15 88.4 88.4 ÷ 8 = 11.05 Remember: The average of the averages is not necessarily the average
5-15Rank order of states from highest to lowest per capita expenditure on lottery • Massachusetts • Rhode Island • Connecticut • Maine • New Hampshire • Vermont What might be some reasons for this order?
5-16Rank order of states from highest to lowest per capita expenditure in gambling • Connecticut • Massachusetts • New Hampshire • Rhode Island • Maine • Vermont What might be some reasons for this order? What might be a reason this order is different from the order of expenditure on lottery?