Benchmark Dose Rate Analysis from Eight Locations at V.C. Summer Nuclear Station
This report presents an average dose rate analysis from eight general area locations within the V.C. Summer Nuclear Station, focusing on the bottom area of the Reactor Cooling System (RCS) loops. It emphasizes the importance of using stored dose rate data from electronic dosimeters for accuracy. Historical context is provided, illustrating how decisions regarding Reactor Coolant Pump (RCP) operation during outages were initially based on subjective assessments but evolved towards analytical justification. Over 80% of plant dose exposure is traced to the loops during outages, highlighting critical safety and operational considerations.

Benchmark Dose Rate Analysis from Eight Locations at V.C. Summer Nuclear Station
E N D
Presentation Transcript
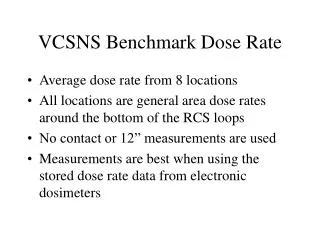
VCSNS Benchmark Dose Rate • Average dose rate from 8 locations • All locations are general area dose rates around the bottom of the RCS loops • No contact or 12” measurements are used • Measurements are best when using the stored dose rate data from electronic dosimeters
History of Benchmark Dose Rate • All outages prior to RF11 HP and Chem used gut feel to decide when RCPs secured, • OR Operations and Outage Management decided for them • Wanted analytical justification to run RCPs as long as possible. • Started with 14 pts general area in loops • 80+% of plant dose came from loops during outage
V.C. Summer Nuclear StationRF 10-13 Outage Exposure History RF12 – 109.7 Rem for original scope