Understanding Chi-Square Distribution and Its Applications in Psychology
This document explores the Chi-Square distribution, focusing on hypothesis testing and variance analysis within psychology research. It outlines various applications, including the analysis of male high school basketball players' heights compared to the general population, and the examination of height variance in patients with pituitary dysfunction. It covers both one-tailed and two-tailed tests using Chi-Square statistics, interval estimation, and robustness considerations. Practical examples illustrate how to apply Chi-Square tests effectively in empirical studies.


Understanding Chi-Square Distribution and Its Applications in Psychology
E N D
Presentation Transcript
The 2 Distribution Karl L. Wuensch Department of Psychology East Carolina University
2 on 1 df • From a normally distribution population, draw one score. • Compute • Record that z2. • Repeat this process an uncountably large number of times. • The resulting sampling distribution is chi-square on one degree of freedom.
2 on 2 df • From a normally distribution population, draw two scores. • Transform each to z • Sum the two z scores and record that sum • Repeat this process an uncountably large number of times. • The resulting sampling distribution is chi-square on two degrees of freedom.
2on ndf • Now, substituting (n - 1)s2for (Y - )2 • We obtain • df here = (n – 1)
Inferences about Variances and Standard Deviations • H: 2 6.25 H1: 2< 6.25 • Y is height (in) of basketball players • s2 = 4.55, N= 31 • 2= 30(4.55) / 6.25 = 21.84, df = 30 • SAS: p = PROBCHI(21.84, 30); • p = .14
A one-tailed chi-square test indicated that the heights of male high school varsity basketball players (s2 = 4.55) were not significantly less variable than those of the general population of adult men (2 = 6.25), 2(30, N = 31) = 21.84, p = .14.
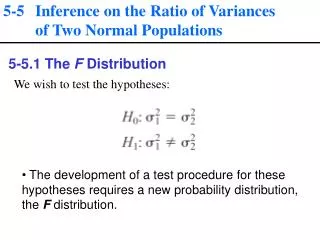
Another Directional Test • H: 2≤6.25 H1: 2> 6.25 • Y is height (inches) of patients with pituitary dysfunction • s2 = 7.95 N = 101 • 2= 100(7.95) / 6.25 = 127.2, df = 100 • SAS: p = 1-PROBCHI(127.2, 100); • p = .034
A one-tailed chi-square test indicated that the heights of men with pituitary dysfunction (s2 = 7.95) were significantly more variable than those of the general population of men (2 = 6.25), 2(100, N = 101) = 127.2, p = .034.
Nondirectional Test • H: 2=6.25 H1: 2 6.25 • Y is height (inches) of patients with pituitary dysfunction • s2 = 7.95 N = 101 • 2= 100(7.95) / 6.25 = 127.2, df = 100 • SAS p = 2*(1-PROBCHI(127.2, 100)); • p = .068
A two-tailed chi-square test indicated that the variance in the heights of men with pituitary dysfunction (s2 = 7.95) was not significantly different from that of the general population of men (2 = 6.25), 2 (100, N = 101) = 127.2, p = .069.
Interval Estimation • Where a and b are the / 2 and 1 ( / 2) fractiles of the chi‑square distribution on (n 1) df, obtain • For the pituitary data, a 90% CI is 100(7.95)/124.34, 100(7.95)/77.93 =[6.39, 10.20].
Robustness • This application of 2 is not robust to its normality assumption.
Chi-Square Approximation of the Binomial Distribution • Consider Y = # of successes in a binomial experiment and • From which can be derived • O1 = number of successes, O2 = number of failures, and E is np.
H0: 50% of ECU students are male. • Data: N = 3, all are female • Exact 2*P(Y ≤ 0|p = .5) = 2(.53) = .250 • This chi-square yields a p of .083, not a good approximation.
Correction for Continuity (Yates Correction) • This chi-square yields a p of .25, a much better approximation. • Only make this correction when df = 1.
This application of 2appropriately uses a one-tailed test with nondirectional hypotheses. • The larger the differences between O and E, in either direction, the greater the 2. • Only large values of 2cast doubt on the null.
Half-Tailed Test • H1: fewer than 50% are male • Exact test, one-tailed p = .125. • The one-tailed p from 2is the probability of getting results as or more discrepant with the null (in either direction) than are those you obtained.
By the multiplication rule, the directional p is the product of • getting results as or more discrepant with the null (in either direction) and • The probability of correctly guessing the direction of the outcome • Thus, the half-tailed p is .25(.5) = .125 • Same as the one-tailed p from the binomial.
Multinomial Test • We have more than two categories • Three categories • Went to the Carolina game • Watched it on TV • None of the above • H0: p1 = p2 = p3. • The one-tailed p from 2would be appropriate for this nondirectional test.
One-Sixth Tailed Test • But what if you correctly predicted thatp1 > p2> p3 ? • There are 3! = 6 ways of ordering three things, so you have a 1/6 chance of correctly predicting if just guessing. • Accordingly, the appropriate joint probability is the one-tailed p divided by 6.
One-Way Chi-Square • The null describes a binomial or multinomial distribution. • For example, consider the null that Professor Karl gives twice as many C’s as B’s, twice as many B’s as A’s, just as many D’s as B’s, and just as many F’s as A’s in his undergraduate statistics classes
pA = pF= .1 • pB = pD = .2 • pC = .4 • The observed frequencies are A: 6, B: 24, C: 50, D: 10, and F: 10
2 = 1.6 + 0.8 + 2.5 + 5 + 0 = 9.9; • df= k- 1 = 4, p = .042 • We reject the null. • We could break up the omnibus null into smaller pieces and test them too. • For example, test the hypothesis thatpC= .4, • or the hypothesis that pC = 2 x pB.
Pearson Chi-Square Test for Contingency Tables • H0: A and B are independent (ϕ = 0) • H1: A and B are correlated (ϕ≠ 0)
The marginal probabilities of being chewed are .3 chewed, .7 not. • The marginal probabilities for gender of the owner are .5, .5.
For each cell, the (expected probability) is (A = a) (B = b) under the null • Remember the multiplication rule under the assumption of independence?
For each cell, the (expected frequency) is the expected probability times N. • Shortcut: E = row count (column count) / total N.
df = (# rows - 1)(# cols - 1) = (1)(1) = 1 • p = .029
Shoes owned by male members of the commune were significantly more likely to be chewed by the dog (40%) than were shoes owned by female members of the commune (20%), 2(1, N = 100) = 4.762, p = .029, odds ratio = 2.67, 95% CI [1.09, 6.02].
Yates Correction • Should not be made for contingency table analysis (2 x 2) with one dfunless • Both pairs of marginals (rows and cols) are fixed rather than random. • That is, across repeated samples the marginal probabilities would not vary. • Example: For each variable score = 1 if below median, 2 if above median.
Fisher’s Exact Test • For 2 x 2 tables • Assumes that the marginals are fixed • The marginals are almost never fixed • So I avoid this procedure.
N-1 Chi-Square • For a 2 x 2 table • With small expected frequencies • The N-1 Chi-square may be preferable • Calculate it as (N-1)2 • This procedure may also be useful when you one (or both) of your classification variables can be considered to be ordinal
Misuses of Pearson 2 Non-independence of Observations • Some observations are counted in more than one cell • Day/Night x Chamber • Counts = # lizards in each chamber • Was repeated across days • McNemar’s test may be appropriate
Misuses of Pearson 2 Failure to Include Nonoccurrences • Does residence affect attitude about making Daylight Savings Time permanent? • We ask 20 urban residents and 20 rural.
We mistakenly test the null that half of those who favor permanent DST are urban and half rural. • 2(1, N = 28) = 0.893, p = .35
The appropriate analysis would also include those who disfavor permanent DST. • 2(1, N = 40) = 4.29, p = .038
Misuses of Pearson 2 • Normality • If expected frequencies are low, the 2approximation of binomial/multinomial will be poor. • The result is low power. • This is not much of a problem if the result is significant.
Likelihood Ratio Tests • Compute the likelihood of getting data like those we got were the null true. • Compute the likelihood of getting data like those we got were the truth that state which makes our data most likely. • The test of the null is based on the ratio of these two likelihoods • Often used for multidimensional contingency table analysis.
Strength of Effect Estimates • for a 2 x 2 • Cramér’sphi for more complex tables • Odds ratios
The Cochran-Mantel-Haenzel Statistic • Test the hypothesis that there is no relationship between rows and columns when you average across two or more levels of a third variable. • Graduate Admissions x Sex in several departments at UC, Berkeley
No significant association between Sex and Admissions Decisions.
The Breslow-Day Test • Null hypothesis = odds ratios do not differ across levels of the third variable (department).
Collapse Across Depts. B-F • the odds of a woman being admitted are significantly less than the odds of a man being admitted.
Dept. A Was Odd • The odds of a woman being admitted are significant greater than of a man being admitted.
CMH With A Included • CMH still not significant, but the Breslow-Day is significant.