Download
1 / 11
110 likes | 225 Vues
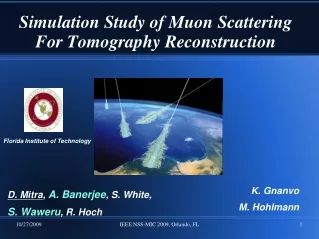
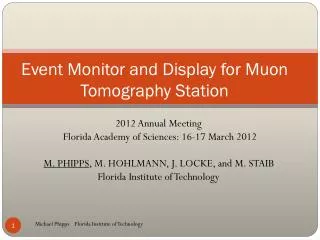
Event Monitor and Display for Muon Tomography Station. 2012 Annual Meeting Florida Academy of Sciences : 16-17 March 2012 M. PHIPPS , M. HOHLMANN, J. LOCKE, and M. STAIB Florida Institute of Technology. Presentation Overview. Research Motivation Event Display Theory

E N D
Event Monitor and Display for Muon Tomography Station 2012 Annual Meeting Florida Academy of Sciences: 16-17 March 2012 M. PHIPPS, M. HOHLMANN, J. LOCKE, and M. STAIB Florida Institute of Technology Michael Phipps Florida Institute of Technology
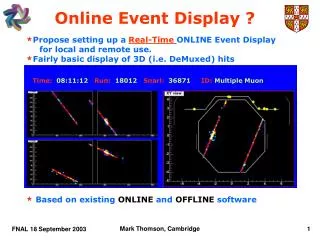
Presentation Overview • Research Motivation • Event Display • Theory • Application: Coverage Distribution • Event Monitor • Live Event Monitor and Display Michael Phipps Florida Institute of Technology
Research Motivation • Makes research and analysis more approachable • Sanity check for validity of results and station configuration • Detector coverage • Display incoming/outgoing path Michael Phipps Florida Institute of Technology
Single Muon Event Michael Phipps Florida Institute of Technology
2d Projections of MTS XZ Projection YZ Projection Michael Phipps Florida Institute of Technology
1000 Muon Events Michael Phipps Florida Institute of Technology
Coverage: Total IntersectingEvents Michael Phipps Florida Institute of Technology
Coverage: SideIntersectingEvents • Insert image with same target Michael Phipps Florida Institute of Technology
Coverage Distribution:50,000 Events with a 50 mm^3 Target Michael Phipps Florida Institute of Technology
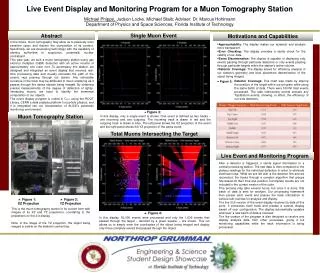
Event Display + DQM • Near Real Time • Dynamic live display and monitoring program • User friendly GUI that automatically updates as data is processed Michael Phipps Florida Institute of Technology
Live Display Shell Michael Phipps Florida Institute of Technology