Download
1 / 28
280 likes | 526 Vues
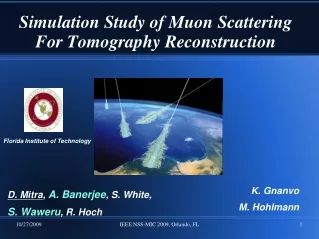
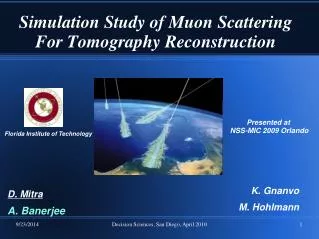
Simulation Study of Muon Scattering For Tomography Reconstruction. D. Mitra A. Banerjee. K. Gnanvo M. Hohlmann. Presented at NSS-MIC 2009 Orlando. Florida Institute of Technology. Muon Scattering. Scattering angle Scattering function distribution: Approx. Normal (Bethe 1953).

E N D
Decision Sciences, San Diego, April 2010 Simulation Study of Muon Scattering For Tomography Reconstruction • D. Mitra • A. Banerjee • K. Gnanvo • M. Hohlmann Presented at NSS-MIC 2009 Orlando Florida Institute of Technology
Decision Sciences, San Diego, April 2010 Muon Scattering Scattering angle Scattering function distribution: Approx. Normal (Bethe 1953) Heavy tail over Gaussian milirad 2 /cm
Decision Sciences, San Diego, April 2010 Types of Tomography • Emission tomography: • SPECT • PET • MRI • Transmission tomography • X-ray • Some Optical • Reflection • UltraSound • Total Internal Reflection Fluoroscopy (TIRF) • Scattering/ Diffusion • Muon tomography • Some Optical (IR) tomography
Decision Sciences, San Diego, April 2010 Experiment • GEANT4 simulation with partial physics for • scattering • Large array of Gas Electron Multiplier (GEM) • detector is being built • IEEE NSS-MIC’09 Orlando Poster# N13-246
Decision Sciences, San Diego, April 2010 Reconstruction Algorithms • Point of Closest Approach (POCA) • Purely geometry based • Estimates where each muon is scattered • Max-Likelihood Expectation Maximization for Muon Tomography • Introduced by Schultz et al. (at LANL) • More physics based-model than POCA • Estimates Scattering density (λ) per voxel
Decision Sciences, San Diego, April 2010 POCA Concept Incoming ray 3D POCA Emerging ray Three detector-array above and three below
Decision Sciences, San Diego, April 2010 POCA Result ≡ processed-Sinogram? 40cmx40cmx20cm Blocks (Al, Fe, Pb, W, U) Unit: mm Θ U W Pb Fe Al
Decision Sciences, San Diego, April 2010 POCA • Pro’s • Fast and efficient • Accurate for simple scenario’s • Con’s • No Physics: multi-scattering ignored • Deterministic • Unscattered tracks are not used
Decision Sciences, San Diego, April 2010 ML-EM System Matrix L T Voxels following POCA track Dynamically built for each data set
Decision Sciences, San Diego, April 2010 ML-EM Algorithm (adapted from Schultz et al., TNS 2007, & Tech Reports LANL) • gather data: (ΔΘ, Δ, p): scattering angles, linear displacements, momentum values • estimate track-parameters (L, T) for all muons • initialize λ (arbitrary small non-zero number, or…) • for each iteration k=1 to I (or, until λ stabilizes) • for each muon-track i=1 to M • Compute Cij • (2) for each voxel j=1 to N • // Mj is # tracks • (5) return λ
Decision Sciences, San Diego, April 2010 ML-EM Reconstruction [In ‘Next Generation Applied Intelligence’ (Springer Lecture Series in Computational Intelligence: 214), pp. 225-231, June 2009.] • Slow for complex scenario • Our implementation used some smart • data structure for speed and better • memory usage
Decision Sciences, San Diego, April 2010 POCA Result for a vertical clutter
Decision Sciences, San Diego, April 2010 Slabbing Concept Slabbing Slice 3cm thick
Decision Sciences, San Diego, April 2010 “Slabbing” studies with POCA:Filtered tracks with DOCA (distance of closest approach)Ev: 10MilVertical stack: Al-Fe-W: 50cm50cm20cm, Vert. Sep: 10cmSlab size: 3 cm
Decision Sciences, San Diego, April 2010 POClust Algorithm: clustering POCA points • Input: Geant4 output (list of all muon tracks and associated parameters) • 1. For each Muon track { • 2. Calculate the POCA pt P and its scattering-angle • 3. if (P lies outside container) continue; • 4. Normalize the scattering angle (angle*p/3GeV). • 5. C = Find-nearest-cluster-to-the (POCA pt P); • 6. Update-cluster C for the new pt P; • 7. After a pre-fixed number of tracks remove sporadic-clusters; • 8. Merge close clusters with each-other } • 9. Update λ (scattering density) of each cluster C using straight tracks passing through C • Output: A volume of interest (VOI)
Decision Sciences, San Diego, April 2010 POClust essentials • Not voxelized, uses raw POCA points • Three types of parameters: • Scattering angle of POCA point • Normalized “proximity” of the point to a cluster • how the “quality” of a cluster is affected by the new poca point and • merger of points or clusters • Real time algorithm: as data comes in
Decision Sciences, San Diego, April 2010 POClust Results Medium: Air G4 Phantom U,W,Pb,Fe,Al Size: 40X40X20cm
Decision Sciences, San Diego, April 2010 Three target vertical clutter scenario Al Fe W Al Fe Al-Fe-W: 40cm*40cm*20cm 100cm gap W
Decision Sciences, San Diego, April 2010 Three target vertical clutter scenario:Smaller gap Al-Fe-W: 40cm*40cm*20cm 10cm gap Al Fe W
Decision Sciences, San Diego, April 2010 POClust Results: Reverse Vertical Clutter Medium: Vacuum U Pb Al U-Pb-Al Size:40X40X20cm Gap:10cm
Decision Sciences, San Diego, April 2010 POClust Results Medium: Vacuum U inside Pb box U size: 10X10X10cm Pb Box: 200X200X200 cm Thickness(Pb box): 10cm
Decision Sciences, San Diego, April 2010 Why POClust & Not just POCA visualization? • Quantitate: ROC Analyses • Improve other Reconstruction algorithms • with a Volume of Interest (VOI) or • Regions of Interest (ROI) • Why any reconstruction at all? • POCA visualization is very noisy in a • complex realistic scenario
Decision Sciences, San Diego, April 2010 Additional works with POClust • Clustering provides Volumes of Interest (VOI) inside the container: Run ML-EM over only VOI for better precision and efficiency • Slabbing, followed by Clustering • Clusters growing over variable-sized hierarchical voxel tree, followed by ML-EM • Automated cluster-parameter selection by optimization • 5. Use cluster λ values in a Maximum A Posteriori –EM, as priors (Wang & Qi: N07-6)
Decision Sciences, San Diego, April 2010 POClust as a pre-processor Volume of Interest reduces after Clustering: A minimum bounding box (235cm X 235cm X 45cm) Initial Volume of Interest (400cm X 400cm X 300cm)
EM after pre-processing with POClust • Scenario: 5 targets • VOI : 400X400X300 cm3 • Iterations: 50 • Targets: • Uranium (100,100,0), • Tangsten (-100, 100, 0) W U
Results From EM over POClust generated VOI • Scenario: U, W, Pb, Al, Fe placed horizontally • Important Points: • IGNORE ALL VOXELS OUTSIDE ROI • EM COMPUTATION DONE ONLY INSIDE ROI After Clustering, VOI reduces, #Voxels = 18330 Here, Total Volume = 400 X 400 X 300 cm Voxel Size= 5 X 5 X 5 cm #Voxels = 384000
Decision Sciences, San Diego, April 2010 A human in muon! …not on moon, again, yet … Twenty million tracks In air background 130cmx10cmx10cm Ca slab inside 150cmx30cmx30cm H2O slab GEANT4 Phantom
Decision Sciences, San Diego, April 2010 Thanks! Debasis Mitra dmitra@cs.fit.edu Acknowledgement: Department of Homeland Security National Science Foundation & many students at FIT