Advanced Climate Modeling and Prediction
Explore the evolution of climate modeling from 1-D radiative-convective models to advanced 3-D atmosphere-ocean general circulation models. Discover the impact of greenhouse gases on surface warming and stratospheric cooling in detailed simulations.

Advanced Climate Modeling and Prediction
E N D
Presentation Transcript
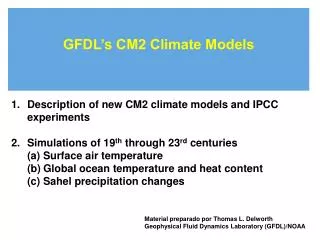
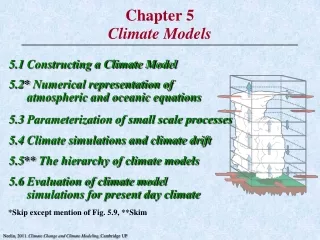
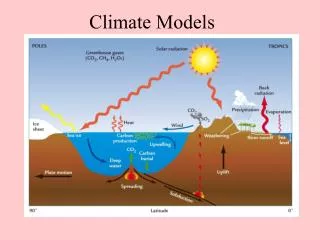
1-D Radiative convective models The atmosphere is divided into several (about 50) vertical layers. Each layer can either represent the global average conditions at that altitude or the average conditions over some particular location on Earth at a particular time. The radiative convective models are key to more complex models.
2-D Models Putting several radiative convective models together one can create a 2-D model predicting climate conditions as a function of latitude and height. The transport of heat from the equator to pole is an important variable in 2-D climate models. If a 1-D model has 40 vertical layers, its 2-D model counterpart with 20 latitude bands (9 degrees each) from South pole to North Pole has 800 grid boxes.
3-D Atmosphere Ocean General Circulation Model A 3-D General circulation model has many more grid boxes because it looks at latitude, longitude, and altitude variation. If you wanted 10 degree longitude resolution and created a 3-D model from the previous 2-D model there would be 800x36=28600 boxes. Modern day atmospheric general circulation models are also coupled to ocean circulation models, biosphere models, and surface/sub-surface hydrology models making them very complex. Full climate system models also have many vertical layers in the ocean and up to 10 for soils, and ice.
½ x ½ degree resolution requires 720x 360 surface boxes=259,200 surface boxes • And 50 layers in the atmosphere results in 12.6Million total model boxes. • Couple to an Ocean Model, Biosphere model, soil model …. • Each calculation time step may represent 10 minutes of real life.
Predicted warming is largest at high NH latitudes especially in winter, and largest over land compared to oceans http://www.vets.ucar.edu/vg/IPCC_CCSM3/index.shtml
Surface warming Stratospheric cooling Most model simulations suggest that the Troposphere warms and the stratosphere cool when atmospheric levels of greenhouse gases increase.
Ozone loss cools stratosphere increases PSCs and enhances Ozone loss Stratospheric Ozone Stratospheric Temps Polar Stratospheric Clouds & CFCs CO2 increases cools stratosphere increases PSCs and enhances Ozone loss Atmospheric CO2 So even as CFCs drop PSCs may increase and delay ozone hole recovery