Comparative Analysis of dN and dS Values Across Genomic Sequences
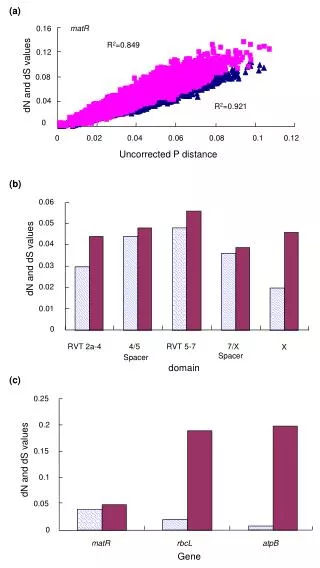
This study presents a detailed analysis of dN (nonsynonymous substitution rate) and dS (synonymous substitution rate) values across various genomic sequences. Using the matR, rbcL, and atpB genes as key examples, we observe significant correlations between dN and dS values, with R² values reaching 0.921. The uncorrected P-distance and additional metrics indicate variability in evolutionary pressures among sequences. Such insights are crucial for understanding molecular evolution and can inform future research in phylogenetics.

Comparative Analysis of dN and dS Values Across Genomic Sequences
E N D
Presentation Transcript
(a) matR 0.16 R2=0.849 0.12 dN and dS values 0.08 0.04 R2=0.921 0 0 0.04 0.06 0.08 0.1 0.12 0.02 Uncorrected P distance (b) 0.06 0.05 0.04 dN and dS values 0.03 0.02 0.01 0 RVT 2a-4 4/5 RVT 5-7 7/X X Spacer Spacer domain (c) 0.25 0.2 0.15 dN and dS values 0.1 0.05 0 matR rbcL atpB Gene