Download
1 / 20
200 likes | 462 Vues
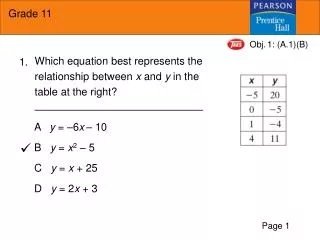
1: (A.1)(B). Which equation best represents the relationship between x and y in the table at the right?. 1. A y = –6 x – 10 B y = x 2 – 5 C y = x + 25 D y = 2 x + 3. . Page 1. 1: (A.1)(C).

E N D
1: (A.1)(B) Which equation best represents the relationship between x and y in the table at the right? 1. A y =–6x– 10 B y = x2 – 5 C y = x + 25 D y = 2x + 3 Page 1
1: (A.1)(C) • A plumber charges $40 to visit a house, $10 per hour for his work, and $5 per valve he has to replace. Which equation represents the total cost, C, based on the hours worked, h, and the number of valves replaced, v? 2. F C = 10h + 5v G C = 40(h + v) + 15 H C = 40 + 15(h + v) J C = 40 + 10h + 5v Page 2
2: (A.2)(D) 3. • The scatter plot at the right shows the relationship between the ages of various cars of the same model and their values. • Approximately how much should you expect to pay for a 6-year-old car? A $5,000 B $10,000 C $15,000 D $20,000 Page 3
2: (A.3)(A) • A class contains 12 boys and 16 girls. The average height of boys in the class is b inches. The average height of girls is g inches. Which algebraic expression below correctly represents the average height per student for the entire class? 4. FGHJ Page 4
3: (A.6)(E) • What is the x-intercept of the function represented by 3(y – 2) = x + 3? 5. A (0, 3) B (3, 0) C (0, –9) D (–9, 0) Page 5
3: (A.6)(G) • Jake’s car used 18 gallons to drive432 miles. About how many gallonswould Jake’s car use to drive 864 miles? 6. F 2 gallonsG 9 gallons H 36 gallons J 48 gallons Page 6
4: (A.7)(B) • The graph of the equation y = 2x – 2 is shown at the right. • Which of the following is foundin the solution set of y < 2x – 2? 7. A (2, 2) B (1, 1) C (1, –1) D (–2, 2) Page 7
4: (A.7)(C) • Perry walks to school, a distance of1.4 miles. If he must arrive at school in30 minutes or less, what is a reasonablerate for him to walk in miles per hour? 8. F 1.5 G 2.9 H 4.5 J 5.5 Page 8
5: (A.9)(D) • A graph of the area of a square based on its side length is shown at the right. What is true about this graph? 9. The number value of the area is always greater than the number value of the side length. A B The area is 4 when the side length is 4. C The maximum possible area is 9.D The area is 9 when the side length is 3. Page 9
5: (A.11)(A) • Which expression is equivalent to ? 10. F x7G 4x7H x6J 4x6 Page 10
6: (G.4)(A) Quadrilateral ABCD has mA = mC = 60° and mB = mD = x. Which equation can be used to find x? 11. A 2x = 360 – 2(60) B 2x = 360 + 120C x = 180 – 2(60) D x = 180 + 60 + 2(60) Page 11
6: (G.5)(D) • A square piece of material used formaking a school banner has area of16 square feet. Find the approximatelength of the diagonal of the banner. 12. F 4ft G 4.5 ft H 5ft J 5.7ft Page 12
7: (G.6)(C) • The top, front, and right views of a solid built with cubesare shown below. 13. How many cubes are needed to construct this solid? A 10B 13C 15D 19 Page 13
7: (G.7)(B) • Which line does NOT intersect the line passing through the points (15, 8) • and (7, 18)? 14. F 4x – 5y = 10G 8x + 10y = 10H 10x – 8y = 10J 15x + 12y = 10 Page 14
8: (G.8)(A) • What is the total area of the figure below? 15. A 45.0 in.2B 55.0 in.2C 64.8 in.2D 74.6 in.2 Page 15
8: (G.11)(B) • In the diagram at the right, BC and DE are parallel. • If AD = 10 units, AB = 15 units, and AE = 12 units, what is AC? 16. F 8 unitsG 12 unitsH 18 unitsJ 24 units Page 16
9: (8.11)(B) • The chart shows the naptimesof 100 children. • For the next 1000 children surveyed, what is the best prediction of how many willhave a naptime at 1:30 P.M.? 17. A 170B 220C 260D 350 Page 17
9: (8.12)(A) • What measure of central tendency wouldbest describe the data in the list below? 18. 1, 2, 3, 6, 10, 15, 20, 22, 25, 30, 32, 250 F mean G medianH modeJ range Page 18
10: (8.14)(C) • What is the area of the shaded triangle withinthe rectangle? 19. A B C D Page 19
10: (8.15)(A) Lydia arrives home at 9:30 P.M. after spending 3 hours doing research at the library. Before this, she was working on math homework, which took as much time as the research. If Lydia took a 30-minute break between the two tasks, at what time did she start her math homework? 20. F 3:45 P.M.G 4:15 P.M. H 5:30 P.M.J 6:00 P.M. Page 20