Enhancing Operations Management: Strategies for Effective Product and Service Delivery
410 likes | 523 Vues
This overview of operations management highlights the transformation of inputs into goods and services, emphasizing the key components such as productivity, quality control, and decision-making strategies. It addresses the critical challenges faced by operations managers in increasing output value, minimizing costs, and eliminating waste. The text outlines methods to improve productivity through effective resource management and strategic decision-making processes, including break-even analysis to determine product feasibility. Learn how to optimize operations for both manufacturing and service-oriented environments.

Enhancing Operations Management: Strategies for Effective Product and Service Delivery
E N D
Presentation Transcript
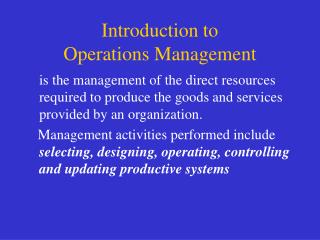
Operations Management ACTIVITIES THAT RELATE TO THE CREATION OFGOODS AND SERVICES THROUGH THE TRANSFORMATIONOF INPUTS INTO OUTPUTS
Feedback Input People Materials Equipment Money Management Output Goods Services Transformation Feedback Transformation Process
Physical product Output inventoried Low customer contact Long response time Intangible product Cannot inventoried High customer contact Short response time Manufacturing and Services
World markets Large facilities Capital intensive Quality easily measured Local markets Small facilities Labor intensive Quality not easily measured Manufacturing and Services
MAJOR CHALLENGES TO OPERATIONS MANAGERS • Increase the VALUE of output relative to the COST of input. • Increase PRODUCTIVITY PRODUCTIVITY = OUTPUT INPUT
PRODUCTIVITY Productivity is the quotient obtained by dividing output by one of the factors of production. One can speak of productivity of capital, labor, raw materials, etc.
INCREASE OUTPUT MINIMIZE DEFECTS IMPROVE QUALITY REDUCE INPUTS ELIMINATE WASTE FEWER HOURS LOWER ENERGY IMPROVE QUALITY WAYS TO IMPROVE PRODUCTIVITY
Example : Productivity • Example:Output = $1000 • Inputs: human = $300 material = $200 capital = $300 energy = $100 other exp.= $50 • Human Productivity = 1000 / 300 = $ / $ 3.33 • TotalProductivity = 1000 / 950 = $ / $ 1.053
Example : Productivity Output = 600 insurance policiesInputs: human = 3 employees working 8 hours / day for 5 days • Labor Productivity = 600 / (3)(5)(8) = 5 policies / hour
Decision Making • Positioning Decisions Product Planning--Positioning Strategies and Quality Management • Design Decisions Process Design, Work Force Management, Capacity, Location, Layout • Operating Decisions Materials Management, Production Planning and Scheduling, Inventory, Supply Chain, Project Scheduling, Quality Control
Decision Making Horizons • Strategic Planning:5 - 10 yr. Less certainty - Less detail - Goal-oriented • Operational Planning:3 mos - 3 yr. More Certainty - More Means-oriented - Better Defined • Scheduling:weekly - monthly More attention to detail • Sequencing/Dispatching:hourly- daily Exact order and time of implementation • Control:hourly - daily Feedback on implementation
Steps in Product Planning Step 1: Idea Generation Step 2: Screening Step 3: Development & testing Step 4: Final product design Rejected Ideas
Screening Approaches:Preference Matrix • Weighted Score for each Product based on performance measures • Selection: total score exceeds threshold • Deficient approach - Why ?
Screening Approaches:Break-Even Analysis (BEA) • When do revenues exceed costs? • Total Annual Revenue = Total Annual Cost • Total Annual Revenue = Ann. Fixed Cost + Ann. Variable Cost • PQ = F + c. Q • P = Price in $ / unit • c = Variable cost in $/unit • F = Annual Fixed Cost, $/yr. • Q = Number of units produced
Screening Approaches:Break-Even Analysis (BEA) • Production determines: F & c • Marketing determines: P & Demand • Use BEA to determine if the product BREAKS EVEN at the Expected Demand • Yes --> Continue • No --> Drop Product
Graphical Approach to BEA Given: p= $ 20/unit c=$10/unit F= $100,000
Graphical Approach to BEA Given: p= $ 20/unit c=$10/unit F= $100,000 400 (20, 400) Profit Total Annual Revenues 300 (20, 300) Break-even Quantity Dollars (In Thousands) Total Annual Cost 200 100 Loss Fixed Cost 5 10 15 20 Units, Q (In Thousands)
Graphic Approach to Break-Even Analysis Given: F= $ 100,000 p= $30/patient c= $20/patient
Graphic Approach to Break-Even Analysis Given: F= $ 100,000 p= $30/patient c= $20/patient (2000, 400) 400 Profits 300 Total annual revenues (2000, 300) Total annual costs Dollars (in thousands) 200 Break-even quantity 100 Fixed costs Loss 0 500 1000 1500 2000 Patients (Q)
Example 1: Furniture Plant • Fixed cost = $600,000. • Variable cost = $50 per unit. • Marketing Research indicates firm can sell 15,000 sets at $110 per set. • Is it feasible to build the plant? Solution: Find the break-even point Q = F/(P - c) = 600,000/(110 - 50) = 10,000 patio furniture sets. Therefore, firm should build plant.
Example 2: Luxor Inc. • Began producing cheese in 1993. • 1993 output reached 20,000 lb. at total cost of $40,000 • 1994 output increased to 30,000 lb. at total cost of $50,000
Example 2:(continued) Luxor • What is the variable cost (c) & the fixed cost (F)? Costs stayed the same during 1993/94. Solution: TC = F + c . Q 40,000 = F + 20,000.c for 1993 [1] 50,000 = F + 30,000.c for 1994 [2] Subtracting [1] from [2], 10,000 = 0 + 10,000c, and c = $1 per lb. Substituting for c in [2], F = 40,000 - 20,000 (1) = $20,000 per year
Example 2: (continued)Luxor • If the selling price =$ 2.80 in 1993 & $ 3.20 in 1994, find the productivity in 1993 & 1994. Solution: Productivity = Output/Inputs or Productivity =Tot. A. Revenues/Tot. A. Costs or Productivity = (P . Q) / TC Therefore 1993 Productivity = 2.80 x 20,000/40,000=1.40 1994 Productivity = 3.20 x 30,000/50,000=1.92 so...Productivity improved in 1994 over 1993.
Example 2: (continued)Luxor • If the total cost in 1995 is expected to increase to $60,000, how many lb. should Luxor produce & sell to maintain the same productivity level of 1994? (selling price remains $3.20/lb) Solution: Find the 1995 Q to keep productivity = 1.92 1.92 = 3.20 x Q / 60,000 Q = 36,000 lb.
BEA: Make or Buy Decisions • Total Annual Cost of Making = Total Annual Cost of BuyingFm + Cm . Q = Fb + Cb . Q m = making b = buying • Decision to make or buy • Number of units needed per year exceed BREAK EVEN VOLUME (Q)?
Make-Buy Decisions: Example • In a PC assembly plant, to make hard drives Fixed costs = $200,000 Var. cost = $50/unit. • Hard drives cost $130 to buy. • Should hard drives be made or bought? Solution:Fm + CmQ = Fb + CbQ 200,000 + 50Q = 130Q; Q = 2500 units Q <= 2500 units -- buy Q > 2500 units -- make.
BEA: Selection Among Two Alternatives • Select one of 2 cars, Tonda & Hoyota • Total Annual Cost of Tonda = Total Annual Cost of Hoyota FT + CT Q = FH + CH Q • Q = Break even miles • Solve for Q :If # of miles driven • < Q select the car with the lowest F • > Q select the car with the lowest C
BEA: Selection Among Two Alternatives • Considering two Cars to lease. Annual Costs HoyotaTonda Lease Cost, $ 5,000 8,000 Variable Cost, $/mile 0.3 0.15 • Which car would you lease and why? Solution:FH + CHQ = FT + CTQ 5,000 + 0.3Q = 8,000 + 0.15Q Q = 20,000 miles Lease Hoyota if you drive < 20,000 miles. Otherwise Tonda
BEA: Selection Among Two Alternatives • What if the running cost of the Hoyota went down to $0.25 per mile? Solution: Find the BEP using new running cost: 5000 + 0.25Q = 8000 + 0.15Q Q = 30,000 Select Hoyota if you drive<30,000miles otherwise Select Tonda.
LP-Based Product Selection • Select product(s) that maximize profit while staying within budget General Form: Maximize p1x1 + p2x2 + p3x3 + . . . + pnxn Subject to c1x1 + c2x2 + c3x3 + . . . + cnxn< B xi = 1 if product I is selected, = 0 otherwise pi = Profit of product i, in $ ci = Cost of product i, in $ B = Budget limitation, in $ • Solve and select products whose xi = 1
Product 3 Product 1 Product 2 A B C Product 1 Product 2 D E F Product 3 (a) Process focused Product 1 Product 1 A B D Product 2 Product 2 D E C Product 3 Product 3 E F A (b) Product focused
Process-Focused Strategy • Resources set around similar processes • One center/resource type-no duplication • Products compete for resources • Products move in jumbled (Job Shop) flow • Highly skilled manual operations • Used for low volume customized products • Intensive, frequent customer interaction • Example: Aircraft, Building, Interior Design
Product-Focused Strategy • Resources organized around product • Duplicate operations for different products • Products do not compete for resources • Products move in line flow (Flow Shop) • Highly automated/expensive facilities • Product-specialized and efficient • Used in high volume standard products • Little or no customer interaction • Example: Paper Clips, Tires, Floppy Disks
Five Stages • Product Planning • Introduction • Growth • Maturity • Decline
Life-Cycle of a Product or Service Annual sales Annual dollars Annual profits 0 Introduction Growth Maturity Decline Product planning Life-cycle changes
Life Cycle Audit • Identify stage of product, based on changes in sales/profits • Decide when to drop, revitalize or introduce new products • Cycles vary from product to product
Life Cycle Audit : Example 1 Stage :
Life Cycle Audit : Example 1 Stage : Maturity
Life Cycle Audit : Example 2 Stage :
Life Cycle Audit : Example 2 Stage : Growth