Download
1 / 11
110 likes | 235 Vues
University of Southern Indiana. MAP-Works 2013-2014. MAP-Works and how it works. Improves students’ transition to the college environment Focus on academic success, retention, student development, and student involvement

E N D
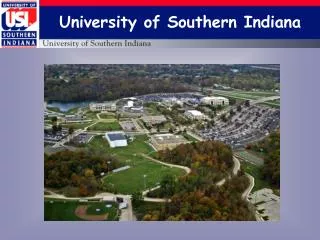
University of Southern Indiana MAP-Works 2013-2014
MAP-Works and how it works Improves students’ transition to the college environment Focus on academic success, retention, student development, and student involvement Transition Survey is the tool that serves as the catalyst for early intervention
History of MAP-Works at USI • Fall ‘08 – University Division & 2 residence halls (582) 460 student responses (79%) • Fall ‘09 – University Division, all university housing, and PLUSS program in the College of Science & Engineering (1,407) 1,060 student responses (75%) • Fall ‘10 – All new freshmen (2,098) 1,295 student responses (62%) • Fall ‘11 – All new freshmen, Assessment Day administration (2025) 1,860 student responses (93%) • Fall ‘12 – All new freshmen, Assessment Day administration (1,853) 1,687 student responses (90.6%)
History of MAP-Works at USI • University Division incorporated MAP student report results into the UNIV 101 class curriculum • Housing and Residence Life staff has used it to identify and resolve problems before they become real issues • LLCs, Honors program, PLUSS advisors, academic departments, and UD have used it as part of the advising process • Assessment Day administration has provided the means to increase response rate
Retention Success at USI Fall 2012 entering Freshmen Class = 1,870 EBI Participation Rate = 90.6% - 1,687 responses Fall 2012 to Spring 2013 Retention • All new freshmen: 86.3% • EBI participants: 88.4% • Non-participants: 67.2%
Other Data… • 454 students accessed their Student Report (24.4%) • 70.7% of students reported that they were committed to getting a degree here • Only 50.5% of students reported with confidence that they can afford tuition and fees next semester • 65.3% of students (1,221) were GREEN in the MAP-Works Risk Indicator • 87.4% of all students’ surveyed had their information reviewed by a student and/or staff member
2013-2014 Administration • Development and implementation of training sessions (several opportunities to attend hands-on training session) • College faculty/staff • University Division • LLCs, Honors program, and CNHP/SEE Advising Centers staff • Student Development staff • Housing and Residence Life staff & RAs • FYE 2014 Instructors
2013-2014 Administration • MAP-Works survey will be part of USI’s fall assessment day testing (4th week of classes) • Expect a 90%+ response rate • Student reports will be available immediately for advisors/staff to utilize • Faculty/staff can incorporate discussion of student feedback reports into the classroom, advising appointments, housing meetings, and programmatic efforts
Impact • A first-year experience for all new 1st-year students • Increase retention & graduation rates • Facilitate academic advising sessions • Assist with enrollment management • Assist faculty/academic staff and residence life staff in preserving and nurturing our campus community • Generate a better understanding of our USI students
Goals for 2013-2014 • Increase fall and spring check-up surveys response rates to 60% • Increase the # of students that view their own student report • Provide targeted impact information to campus community throughout the year • Integrate MAP-Works process into FYE Course for 2014 • Full scale implementation of MAP-Works process with the CNHP and SEE Advising Centers