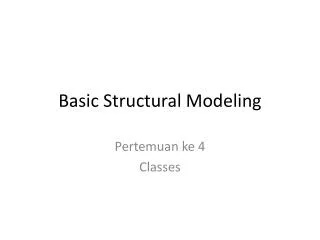
Environmental Modeling Basic GIS Modeling Suitability Index Modeling
Environmental Modeling Basic GIS Modeling Suitability Index Modeling. GIS Modeling Approaches. GIS by itself GIS integrated with statistics GIS integrated with process models. 1. The Delphi Approach.

Environmental Modeling Basic GIS Modeling Suitability Index Modeling
E N D
Presentation Transcript
Environmental Modeling Basic GIS ModelingSuitability Index Modeling
GIS Modeling Approaches GIS by itself GIS integrated with statistics GIS integrated with process models
1. The Delphi Approach • A procedure for obtaining and processing expert judgments to maximize the accuracy of the resulting estimates • Main considerations - Data, budget, and time can be constrained for a scientific evaluation - Human mind is capable of making quite accurate judgments
1. Delphi • Experts' role 1. select appropriate variables 2. estimate magnitude of the ranking 3. assign the weights
1. Delphi • The Delphi steps 1. ask each expert for an independent opinion on carefully prepared questions 2. calculate the median and range of opinions and feed these back to the experts for another round of estimate 3. repeat step 1 and 2 for a few rounds 4. use the median of the final round as the best answer * time and cost factors
Simple Modeling Ranking and weighting M Ruvane, UNC Chapel Hill
2. Land Suitability Analysis • Richmond Parkway, NY evaluation McHarg, I.L., 1969. Design with Nature Korean War Veterans Parkway, in Staten Island http://en.wikipedia.org/wiki/Richmond_Parkway_%28Staten_Island%29
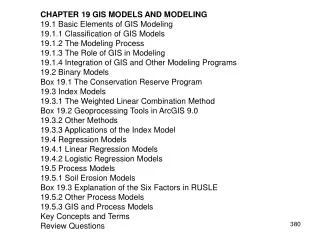
2. Land Suitability Analysis • A total of 16 land variables e.g. slope, drainage, land values, etc. • Each variable is ranked from 1 to 3 e.g. slope<2.5%,3; 2.5%<slope<10%,2; slope>10%,1 • The grand index = summation of ranking * weighting
Ian McHarg Richmond Parkway • Slope zone 1: slope > 10% zone 2: 2.5% < slope < 10% zone 3: slope < 2.5% • Surface drainage zone 1: streams , lakes, and ponds zone 2: natural drainage channels zone 3: absence of surface water
Ian McHarg Richmond Parkway • Soil drainage • Bedrock foundation • Soil foundation • Susceptibility to erosion • Land values • Tidal inundation
Ian McHarg Richmond Parkway • Historic values • Scenic values • Recreation values • Water values • Forest values • Wildlife values • Residential values • Institutional values
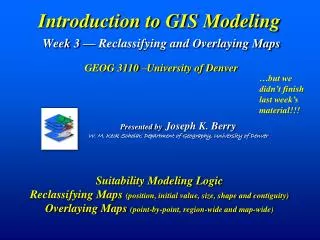
Ranking and Weighting 1.0 0.8 0.6 0.4 0.2 1.0 0.8 0.6 0.4 0.2 20 40 60 80 100% 20 40 60 80 100% 1.0 0.8 0.6 0.4 0.2 1.0 0.8 0.6 0.4 0.2 20 40 60 80 100% 20 40 60 80 100% Carrying capacity for grazers Man-made water loss/total Dissolved Oxygen Density of man-made structures
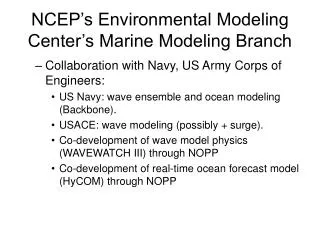
3. The DRASTIC Model • Development - By the National Water Well Association in 1987 for US EPA to evaluate groundwater pollution potential. -It used the Delphi method to design parameters by compiling responses from more than 40 of the nation's leading groundwater scientists.
3. DRASTIC • The model D - Depth to water table R - Recharge A - Aquifer media S - Soil media T - Topography I - Impact of vadoes zone C - Conductivity of the aquifer
Ranges and Ratings for Depth to Water Depth to Water (Feet) Ranges and Ratings for Net Recharge Net Recharge (inches) Range Rating 0-5 10 5-15 9 15-30 7 30-50 5 50-75 3 75-100 2 100+ 1 Range Rating 0-2 1 2-4 3 4-7 6 7-10 8 10+ 9
Ranges and Ratings for Soil Media Soil Media Ranges and Ratings for Aquifer Media Aquifer Media Ranges Rating Thin or Absent 10 Gravel 10 Sand 9 Peat 8 Shrinking and/or Aggregated Clay 7 Sandy Loam 6 Loam 5 Silty Loam 4 Clay Loam 3 Muck 2 Nonshrinking and Nonaggregated Clay 1 Ranges Rating Massive Shale 2 Metamorphic/Igneous 3 Weathered Metamorphic/ Igneous 4 Glacial Till 5 Bedded Sandstone, Limestone And Shale Sequences 6 Massive Sandstone 6 Massive Limestone 6 Sand and Gravel 8 Basalt 9 Karst Limestone 10
Ranges and Ratings for Topography Topography (Percent Slope) Ranges and Ratings for Impact of the Vadose Zone Impact of the Vadose Zone Media Range Rating 0-2 10 2-6 9 6-12 5 12-18 3 18+ 1 Range Rating Confining Layer 1 Silt/Clay 3 Shale 3 Limestone 6 Sandstone 6 Bedded Limestone, Sandstone, Shale 6 Sand and Gravel with significant Silt and Clay 6 Metamorphic/Igneous 4 Sand and Gravel 8 Basalt 9 Karst Limestone 10
Ranges and Ratings for Hydraulic Conductivity Hydraulic Conductivity (GPD/FT2) Range Rating 1-100 1 100-300 2 300-700 4 700-1000 6 1000-2000 8 2000+ 10
4. The Judgment Impact Matrix • It suits for evaluation of complex systems • Estimation structure components -> environmental elements -> societal elements -> grand index • The matrix components x link (0,1) x element set1 x element set2 x weights (for element 2) • The links, environmental, societal and weights can be determined by the Delphi method
Element 1 Element 1 Element 2 Element 2 Policy Elementi Elementi Elementm Elementm 4. JIM Component 1 Component 2 Componenti Componentm
5. A Mock Project • What is the problem Where to spray to control mosquito pop • Factors that affect spray 1: areas of high human pop density 2: adjacent to water bodies 3: low elevation • Find data for each factor • Apply functions to the data
Find Data Factor 1: areas of high population density R Brancoto, SUNY Buffalo
Find Data Factor 2: adjacent to water Function: buffer T Tatignani, SUNY BUffalo
Function Points Lines Polygons Function: Buffer width = M Ruvane, UNC Chapel Hill
Find Data Factor 3: low elevation NIMA & NASA
Ranking and Weighting Suitability = Layer1*1 + Layer2*3 + layer3*3 M Ruvane, UNC Chapel Hill
Slope Aspect Distance to roads From Richard Aspinall Distance to trails
Suitability Index Modeling Owen Earley, GIS/EM4 2000