Understanding Economic Factors in Product Sales
120 likes | 230 Vues
Learn about Total Cost of Ownership, Price Quality Ratio, Mean Time Before Failure, and their impact on product sales. Discover how to analyze costs and reliability for informed purchasing decisions.

Understanding Economic Factors in Product Sales
E N D
Presentation Transcript
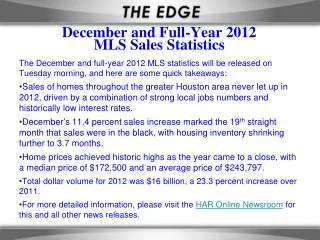
Statistics in Sales June 2007,Alex Righolt
Overview • We don’t sell cheap products. The client decides whether a product is cheap or not. That is why we instead use the word “economic”. • We’ll look at the terms “Total Cost of Ownership” and “Price Quality Ratio” that allow us to compare prices.
Overview • This presentation also introduces the “Mean Time Before Failure” and “Failure Rate” that allow us to compare reliability.
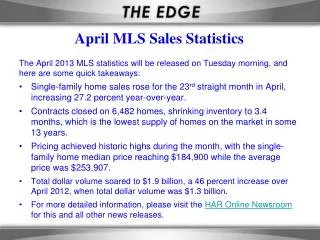
TCO Meaning: Total Cost of Ownership. • Definition: TCO = Direct Costs + Indirect Costs. • Direct costs: usually cost of purchase • Indirect costs: consumables + maintenance + repairs + energy consumption.
TCO A $300 laserjet printer becomes more economic than a $100 inkjet printer after 5,000 printed copies. At 10,000 copies: the TCO of the inkjet is $550 the TCO of the laserjet is $350.
PQR • Meaning: Price Quality Ratio • Definition: PQR = Price Quality
PQR • Example: Shop A sells a PC at $700. It is 50% better than a PC sold at $500 in shop B. PQRA = $700 / 1.5 = $466 PQRB = $500 / 1.0 = $500 It shows that the PC sold at shop A is a better deal, even if its price is higher.
MTBF • Meaning: Mean Time Before Failure • Definition: The average time between failures. • The MTBF is used to measure reliability of items. • The Rate of Failure is calculated as: RF = Failures Millions of hours
MTBF This ‘bath tub’ graph shows the typical Rate of Failure over time.
Analysis of situation 2 • The graph shows that many devices fail early in their life cycle. Ideally, this period is covered by warranty. • After that the Rate of Failure is lower and constant. • Near the end of its lifetime it increases again. • For consumer electronics, The Rate of Failure is lowest in the period of 3 months to 7 years.
Conclusion • You have seen how TCO and PQR are used to describe and compare the costs of a product. • MTBF is used in expressing reliability.
Statistics in Sales. The end

![2011 World Car Sales Statistics [INFOGRAPHIC]](https://cdn0.slideserve.com/763864/slide1-dt.jpg)