Download

1 / 31
320 likes | 469 Vues
Scientific Inquiry. 8-11-11. 8-11-11 Mav Mark. List as many steps of the Scientific Method (in order) as you can. Answer. Ask questions Make observations and inferences Develop hypothesis Design experiments Make measurements Collect data Interpret data Draw conclusions

E N D
Scientific Inquiry 8-11-11
8-11-11Mav Mark • List as many steps of the Scientific Method (in order) as you can.
Answer • Ask questions • Make observations and inferences • Develop hypothesis • Design experiments • Make measurements • Collect data • Interpret data • Draw conclusions • Communicate
8-12-11Mav Mark • Andrew and Alex set up an experiment to test how soil temperature and water temperature vary. The set up two beakers, one with 100 grams of water and one with 100 grams of soil, under a lamp and record the temperature of each every 5 minutes. • What is the independent variable? • What is the dependent variable?
Answer • IV: Materials—soil, water • DV: Temperature • Materials: 2 beakers, soil, water, lamp, thermometers, triple-beam balance, weigh boat • Controlled Exp? Yes—only one variable changed.
8-15-11Mav Mark • Give three examples of qualitative data. • Give three examples of quantitative data.
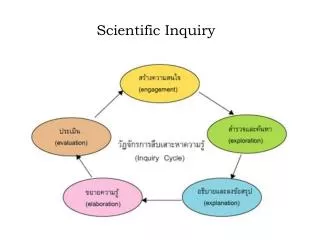
Ask Questions • Scientific inquiry begins with a question or a problem.
Make observations and Inferences • Observation: Using one or more of your senses to collect data • Inference: An interpretation of an observation that is based on evidence or prior knowledge • Data: Facts, figures, and other evidence gathered through observation
Developing Hypothesis • Hypothesis: A possible explanation for a set of observations or answer to a scientific question • A hypothesis must be something that can be tested and research based • Worded as an “If…, Then…” statement • Hypothesis can either be supported or disproved
Designing an experiment to test a hypothesis • After you state your hypothesis, you must design an experiment to test it. • An experiment is a carefully controlled test.
Experiment Variables • Variables: Factors that can change in an experiment • Independent (manipulated) variable: The variable that is changed during the experiment--always expressed on the x-axis on a graph. • Dependent (responding) variable: The factor that changes because of the manipulated. variable—always expressed on the y-axis on a graph.
3 Kinds of Variables • Independent Variable – something that is changed by the scientist • What is tested • What is manipulated
3 Kinds of Variables • Dependent Variable – something that might be affected by the change in the independent variable • What is observed • What is measured • The data collected during the investigation
3 Kinds of Variables • Controlled Variable – a variable that is not changed • Usually referred to as the control • Also called constants • Allow for a “fair test”
For Example: • Students of different ages were given the same jigsaw puzzle to put together. They were timed to see how long it took to finish the puzzle.
What was the independent variable? • Ages of the students • Different ages were tested by the scientist
What was the dependent variable? • The time it to put the puzzle together • The time was observed and measured by the scientist
What was a controlled variable? • Same puzzle • All of the participants were tested with the same puzzle. • It would not have been a fair test if some had an easy 30 piece puzzle and some had a harder 500 piece puzzle.
Controlled Experiments • Controlled Experiment: An experiment in which all of the variables except for one remain the same • Scientific experiments MUST be controlled!
Materials • List of all of the equipment and supplies needed to conduct the experiment. • Example: water, ruler, beaker, salt, hot plate, stirring rod • Know what equipment is used to measure what. • Balance: mass • Graduated cylinder: Volume of liquid
Safety • Add any specific safety instructions for the lab. • Wear goggles. • May stain clothes. • Flammable. • Caution with glass.
Procedure • Step by step instructions outlining the process of testing the hypothesis.
Observations and Data • Qualitative data: description of results of experiment. Tell what it looks like. • The solution boiled. • Quantitative data: numerical data collected during the experiment. (May be expressed in a table and graph.) • The temperature of the solution was 112° F.
Analyze Data • Calculate the measures of central tendency. • Mean: average • Median: middle • Mode: most popular • Range: distance from smallest • Modify the procedure if needed.
Graphs • A graph is a visual representation of data.
Bar Graphs • A bar graph displays discrete data in separate columns. • Advantages • Visually strong • Can easily compare two or three data sets • Disadvantages • Graph categories can be reordered to emphasize certain effects
Line Graph • A line graph plots continuous data as points and then joins them with a line. Multiple data sets can be graphed together, but a key must be used. • Independent variable on the x-axis • Dependent variable on the y-axis • Advantages • Can compare multiple continuous data sets easily • Interim data can be inferred from graph line • Disadvantages • Use only with continuous data
Pie chart • A pie chart displays data as a percentage of the whole. Each pie section should have a label and percentage. • Advantages • Visually appealing • Shows percent of total for each category • Disadvantages • No exact numerical data • Hard to compare 2 data sets • "Other" category can be a problem • Best for 3 to 7 categories
Conclusion • Include a statement that accepts or rejects the hypothesis. • Make recommendations for further study and possible improvements to the procedure
Communication • It is essential to communicate the results of an experiment in a lab report. • This report must be repeatable to be considered valid.