
Group: Members:
E N D
Presentation Transcript
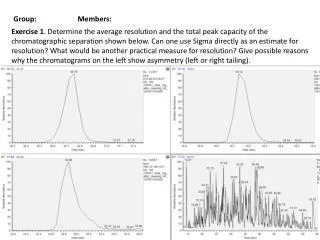
Group: Members: Exercise 1. Determine the average resolution and the total peak capacity of the chromatographic separation shown below. Can one use Sigma directly as an estimate for resolution? Whatwouldbeanotherpracticalmeasureforresolution? Give possible reasons why the chromatograms on the left show asymmetry (left or right tailing).
Group: Members: Exercise 2. Determine the type of chromatography given the elution order shown below. Explain how you arrived at this conclusion.
Group: Members: Exercise 3. Determine the sequence of this post-translationallymodified peptide from the tandem MS spectrum shown. Also, determine the modified amino acid and the type of modification.
Group: Members: ? ? ? ? ? ? Exercise 4 In this research project a SILAC experiment is performed. The heavy labeled cells overexpress a certain bait protein. The light labeled cells only express the endogenous protein.Cells were mixed and an immunoprecipitation against the bait protein was performed.Samples were measured on a LC-MS/MS. Quantification was performed by Maxquant. In the excel file you find the Intensities of the Heavy and Light version of the proteins 1.Calculate the ratio for these proteins 2. Make a scatter plot of the distribution of ratio versus intensity 3. From the ratio’s determine what the bait protein is, and which are possible binding partners of the bait protein ? ? Heavy labeled cells Overexpressing the bait protein Light labeled cells Expressing the bait in endogenous levels
Group: Members: Exercise 5 In this experiment cells were treated with 5 different concentrations of the drug Lapatinib. Subsequently kinases were enriched using the Kinobeads approach Purified kinases were analyzed using LC-MS/MS. Intensity based label free quantification was performed for all identified proteins In the excel file you will find the intensities of the proteins quantified at different drug concentrations Using this information, find the drug target! Make an inhibition curve for this target protein
Group: Members: Below two MS/MS spectra of 2 peptides from a unknown protein are displayed Use a sequence tag search to determine the identity of the protein .