Download
1 / 40
400 likes | 539 Vues
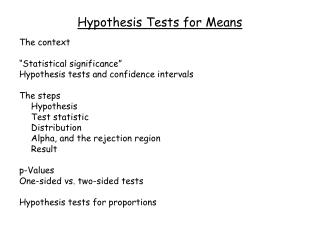
HypothesisTest for Means. Chapter 9,Section 1. Statistical Methods II. QM 3620. Let’s Change ourThinking. You have been busy calculating confidence intervals to estimate means and proportions ... but, what if someone asked you if a statement was true or not?

E N D
HypothesisTestforMeans Chapter9,Section1 StatisticalMethodsII QM3620
Let’sChangeourThinking Youhavebeenbusycalculatingconfidenceintervalstoestimatemeansand proportions... but, whatifsomeoneaskedyouifastatementwastrueornot? Couldyouansweritfromyourconfidenceinterval? Supposethatmanagementwouldliketoknowtheaverageamountspentby customersinthestore.Thisisimportanttomanagementastheywouldloveto thinkofingeniouswaystomakecustomersspendmore.
Let’sChangeourThinking Youtakearandomsampleofcustomersandfindthattheaverageamountspent is $24.35. So…$24.35istheaverageamountspentbyallcustomers right? Let’ssay the confidence interval is $22.00to $26.70at95%confidence.Thatmeansthatyouare pretty surethattheaverageamountspent byacustomerissomewherebetweenthosenumbers. But that is not what management wants…..
Let’sChangeourThinking Managementsays “Wedidn’twantthat.We think thatweneedatleast$25.00tobespent onaverageinthestoretojustifyitsexistence. Canyou tell us that?” You can makeupananswer…orfindawaytoaddressthatdirectquestion withoutsayingyouneedalotmoremoneytotalkto ALLofthecustomers. Couldweusetheinformationinasampletoaddressadirectquestion?
ThinkaboutaConfidenceInterval The confidence interval could partially address the question. The population average of $25.00 or more for ALL customers is a real possibility. But, the confidence interval chopped off values that were above $26.70 – the high end of the interval. Those values are relevant here. Management asked if the average was greater than $25.00. What we really need is a way to directly answer a question about a mean … or a proportion (but that will wait until the next module.)
The Hypothesis In scientific terms, we would pose a question as a hypothesis. We could then test the hypothesis to see if it is reasonable … or downright wrong. We can do the same thing here … but how do we set this up? (pages 376 through 378 in your text).
So, WhatisaHypothesisanyway? Ahypothesisisaclaimorstatementthatyou wishtomakeaboutpopulation, specifically somevariableorcharacteristicofthat population.Forexample: Aclaimaboutapopulationmeanmightbe… Theaveragecustomerbillatourstore(µ)atourstoreis$25ormore. Aclaimaboutapopulationproportionmightbe… Theproportionofcustomers()whospendmorethan$18duringa storevisitis.38.
TheNullHypothesis, HO Canstatethestatusquothatneedstobechecked. Has it changed? Theaveragecustomerratingofourservice(µ)isthesameasitused tobe(4.3outof5). H0: μ=4.3 Canalsorepresenttheopposingpositionwhenaresearch hypothesisorclaimisinthealternativehypothesis. Want to prove? Theaveragecustomerbillatourstore(µ)atourstoreis$25orless. H0:μ$25 Isalwaysaboutsomethinginthepopulation, notabouta calculationinthesample: H0:μ$25 H0:x$25
TheNullHypothesis, HO Weassumethatthenullhypothesisistrue, andthen seeifthereisevidencetoindicateotherwise Similartoassumingsomeoneisinnocentina criminaltrial Thenullhypothesiscanneverbeprovenina hypothesistest.Itisthe“fallback”positionin casethealternativecannotbeproven. Contains“=”,“≤”or“”sign. Can’t prove with a sample.
The AlternativeHypothesis, HA Istheoppositeofthenullhypothesis Canrepresenttheresearchhypothesisorclaimthatisintendedto beproven. HA:μ$25 Theaveragecustomerbillatourstore(µ)atourstoreis morethan$25. Canbetheoppositeofthestatusquotodetermineifthestatusquo isnolongervalid. HA: μ ≠ 4.3 Theaveragecustomerratingofourservice(µ)isno longer thesameasitusedtobe(4.3outof5). Nevercontainsanypartofthe“=”sign,including“≤”or“”. Apopulationparametercanneverbeproventoequalavalue withoutlookingattheentirepopulation. Isgenerallythehypothesisthatisintendedtobeproven–likeguilt inacriminaltrial Alsoknownastheresearchhypothesis
FormulatingHypotheses–Example1 FordMotorCompanyhasworkedtoreduceroadnoiseinsidethecabofthe redesignedF150pickuptruck.Itwouldliketoreportinitsadvertisingthatthe truckisquieter.Theaverageofthepriordesignwas68decibelsat60mph. Whatistheappropriatehypothesistest? What is Ford trying to prove? New design is quieter. HO:µ≥68(thetruckisnotquieter)statusquo HA:µ<68(thetruckisquieter)claimFordwishestomake Ifthenullhypothesisisrejected, Fordhassufficientevidenceto supportthatthetruckisnowquieter.
FormulatingHypotheses–Example2 The average annual income of buyers of Ford F150 pickup trucks is claimed to be $65,000 per year. An industry analyst would like to test this claim. Whatistheappropriatetest? What is analyst trying to prove? HO:µ=65,000(incomeisasclaimed)statusquo HA:µ≠65,000(incomeisdifferentthanclaimed)wantstoproveorsupport Theanalystwillbelievetheclaimunlesssufficientevidenceis foundtodiscreditit.
Hypothesis TestingProcess Claim:Thepopulationmeanageis50. NullHypothesis: HO:themeanage(µ)=50 Population Selectarandomsample: Sample Ifnotlikely,then Isx=20 likelyif µ=50? Supposethesamplemean ageis20:x=20 RejectNullHypothesis Itisnotlikelythatthemean ageofthepopulationis50ifa samplehasameanageof20.
ReasonsforRejectingHO SamplingDistributionofx Thissamplingdistributionofx showswherethesamplemean wouldlikelyfallifthemeanfor thepopulationwasactually50. x 20 μ=50 Assuming H0istrue Ifitisunlikelythatwe wouldgetasamplemean ofthisvalue... ...ifinfactthiswere thepopulationmean… ...thenwerejectthenull hypothesisthatμ=50.
ErrorsinMakingDecisions TypeIError Madebyrejectingatruenullhypothesis Consideredaserioustypeoferror Theprobabilityof TypeIErroris Calledlevelofsignificanceofthetest Canbesetinadvance
ErrorsinMakingDecisions TypeIIError Failtorejectafalsenullhypothesis Theprobabilityof TypeIIErrorisβ βisimpossibletoknowandhardtoestimate Thebestapproachistosimplyusethemost powerfulstatisticaltest–that’swhyyourely onastatisticiantoteachyouthesethings. Thepowerofahypothesistestistheabilityto notmakethiserror
OutcomesandProbabilities PossibleHypothesisTestOutcomes Key:Outcome (Probability)
OutcomesandProbabilities Why is Type 1 error considered serious? A pharmaceutical company is testing new drug wants to know if it is too dangerous. What are the hypotheses? What is the question? H0: Drug is safe HA: Drug kills people What if we fail to reject H0 when we should (Type 1 error)?
LevelofSignificance, Definesthechanceyouwanttotakeofaccidentally rejectingatruenullhypothesis (type 1 error) Definestherejectionregion(whenyouaregoingtoreject thenullhypothesis) Isdesignatedby,thelevelofsignificance Typicalvaluesare.01,.05,or.10 Isselectedpriortodoingthehypothesistest (Latin:apriori)
ProcessofHypothesisTesting Specifypopulationparameterofinterest Formulatethenullandalternativehypotheses Specifythedesiredsignificancelevel, Takearandomsampleandcalculaterelevant statistics Calculatep-valuefortestandcompareitto Reachadecisionanddrawaconclusion 1) 2) 3) 4) 5) 6)
p-value-Whatisit? p-value:Represents the evidence against Ho. How likely we are to get a certain sample result or a result “more extreme,” assuming H0 is true Alsocalledtheobservedlevelofsignificance SmallestvalueofforwhichHOcanbe Rejected Smaller p-value, more agreement with rejecting Ho
p-value ApproachtoTesting Calculateteststatisticfromsample information Determinethep-valueoftheteststatistic usingsoftwareonthecomputer Comparethep-valuewith Ifp-value≤,rejectHO Ifp-value>,donotrejectHO
One-Tailed Test: p-valueExample Example:Howlikelyisittoseeasamplemean of2.84(orsomethingevenfurtherbelowthe mean)ifthetruemean()is3.0? =.05 p-value=.0228 H0: > 3 HA: < 3 μ=3 X=2.84
One-Tailed Test: p-valueExample Comparethep-valuewith Ifp-value≤,rejectHO Ifp-value>,donotrejectHO =.05 p-value=.0228 =.05 p-value=.0228 Since.0228≤.05,werejectthenull hypothesis μ=3 X=2.84
TheTestStatistic Youaregoingtoneedtocalculateateststatisticinordertofind ap-value. Takethedifferencebetweenthesamplemeanandthe hypothesizedmean, andthendividethatdifferencebythestandard errorofthesamplemean. Theteststatistic(TS)isjustastandardizedwayofseeingexactlyhowfaryoursamplemeanisaway fromthehypothesizedmean. x-μ0 TS s n
Summary: Findingthep-valuewithExcel Twotailedtest Example: H0:μ=3 HA:μ≠3 p-value Lowertailtest Example: H0:μ≥3 HA:μ<3 p-value Uppertailtest Example: H0:μ≤3 HA:μ>3 p-value Test Statistic Test Statistic Test Statistic Test Statistic OR =TDIST(-TS,n-1,1) =TDIST(ABS(TS),n-1,2) =TDIST(TS,n-1,1) Thevalueofthe teststatistic precededbya negativesign Theabsolute valueofthetest statisticusingthe ABS()function Thevalueofthe teststatistic NOTpreceded byanegativesign Aone- tailedtest Atwo- tailedtest Aone- tailedtest Thesample sizeminus1 Thesample sizeminus1 Thesample sizeminus1
Excel’s TDISTfunction–UpperTailed Excel’sTDISTfunctiontestofan upper-tailedalternativehypothesisis theeasiest(i.e.HAshowsa“>”sign). HO:μ≤3 HA:μ>3 Suppose Thehypothesized value(μO)is3. p-value=TDIST(TS,n-1,1) Remember,ifthesamplemeanis actuallybelow3inthiscase (alreadyintheHOregion),then thereisnoreasontogoforward withthehypothesistest.Theresult isobvious. xo s n TS Aone-tailedtest
Excel’sTDISTfunction–LowerTailed Excel’sTDISTfunctiontestofanlower- tailedalternativehypothesisissomewhat tricky(i.e.HAshowsa“<”sign). HO:μ≥3 HA:μ<3 Suppose TomaketheTDISTfunctionwork,weneedtore- orienttheteststatistictotheuppertailby removingthenegativesigninfrontofit.Thatcan beaccomplishedbysimplytakingthenegativeof theteststatisticvalue. Thehypothesized value(μO)is3. p-value=TDIST(-TS,n-1,1) n Remember,ifthesamplemeanis actuallyabove3inthiscase(already intheHOregion),thenthereisno reasontogoforwardwiththe hypothesistest.Theresultisobvious. xo TS Aone-tailed test s
Excel’sTDISTfunction–TwoTailed Excel’sTDISTfunctiontestofatwo- tailedalternativehypothesisisnottoo bad(i.e.HAshowsa“”sign). Tofindthetotalprobabilityinboth areas,youneedtousethe ABS() functionsothatyoualwayshavea positiveteststatistic.Also,besure tosetthenumberoftailsto2. HO:μ=3 HA:μ3 Suppose Thehypothesized value(μO)is3. p-value=TDIST(ABS(TS),n-1,2) n xo TS Excel’sAbsolute Valuefunction Atwo-tailed test s
Statistical Terms The Null and Alternative Hypothesis Hypothesis tests start with the hypothesized value. The null and alternative hypothesis lay out the options regarding that number. Based on our data which one is likely the true situation? That is what the hypothesis test is all about. The Alpha Level The alpha level is the degree to which you are willing to take a chance ...the chance of making a type I error. What is that? The error of rejecting the null hypothesis when it is true.
Statistical Terms The Test Statistic The test statistic represents a measure of the agreement of the data with the hypothesized value. To find out the strength of the agreement, we compare the test statistic with the appropriate statistical table and we end up with the …
Statistical Terms The p-value This is our measure of agreement with the null hypothesis. Read that again … with the null hypothesis. If the p-value shows support for the null hypothesis, then it will be large (or at least larger than α). If the p-value supports the alternative hypothesis, then it will be small (less than or equal to α). But realize, we make our judgments about the alternative hypothesis because that is what this test is all about. Did we or did we not find enough evidence to support the alternative hypothesis.
Statistical Terms The Assumptions If we are working with small samples, then we need to have data that is reasonably mound-shaped. We can check that with a histogram. If the sample is large, no check is necessary; the Central Limit Theorem takes over. This test is fairly robust, so as long as our data do not indicate a really non-normal distribution, we will be okay. Also, we always assume that our sample is fairly random and not biased.
ApplicationTime Let’strythisforreal
Business ApplicationHighlights DairyFreshIceCreamproducesicecreaminaplantinGreensboro, Alabama (pg. 392). Afillingmachineissettoput64ouncesoficecreaminevery64oz. carton. Managementwantstoensurethatthemachineisfillingcartonsproperly.Thisis normalaspectofproductqualitycontrol. Asampleof16cartonsistakenandtheweightoftheicecreamisdeterminedand recorded.
UsingStatistics TheNulland AlternativeHypothesis Wearetryingtotesttoseewhetherthefillingmachineisoutofadjustment (not status quo).Whenyouaretryingto showsomething, thatisalmostalwaysyouralternativehypothesis.What is the alternative hypothesis? HA: μ ≠ 64 The AlphaLevel Theproblemstatesthatthealphalevelshouldbesetto0.05. The Assumptions Thesamplesizeisprettysmallat16.Wewillneedtocheckthegeneralshapeofthedatausinga histogram.
Business ApplicationHighlights TheQwestCompanyoperatesservicecentersaroundthecountrytoanswer questionscustomersposeabouttheirbills (pg. 394). Thetimeneededtoserviceeachcustomer’scalldrivesthecompaniesprofitability throughacceptableservicetimes(customerstandpoint)andcostcontainment (companystandpoint). ItiscriticalforQwesttomonitoritthetimeittakestoserviceeachcall. Previousstudiesoftheamountoftimerequiredpercallindicatethatthe distributionismound-shaped, withanaverageof540seconds. Asampleof16callsisrandomlyselectedandthetimeofthecallwasmeasured andrecorded.
UsingStatistics TheNulland AlternativeHypothesis Itstatesinthenarrativethatcompanyofficialswishtodetermineiftheamountoftimetoservicea customerhasdecreasedonaverage. It was 540. What is the hypothesis: H0: μ > 540 HA: μ < 540 The AlphaLevel Theproblemstatesthatthealphalevelshouldbesetto0.01.Thismakesadifference, soalwayslookfor thealphalevelintheproblem.Generally, whenitismissing, thedefaultis0.05.
ApplicationTime Let’sdo this…..