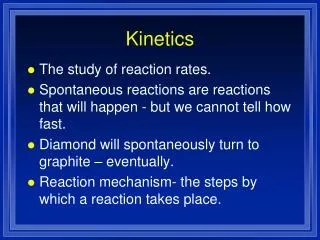
Reactant Kinetics Graphs in Chemical Reactions
Explore kinetics by sketching various graphs for reactions with different reactant concentrations and limiting reagents. Includes mass-time and volume-time graphs for hydrogen, CO2, and oxygen production. Analyze temperature-time graph for sodium thiosulphate and HCl reaction.

Reactant Kinetics Graphs in Chemical Reactions
E N D
Presentation Transcript
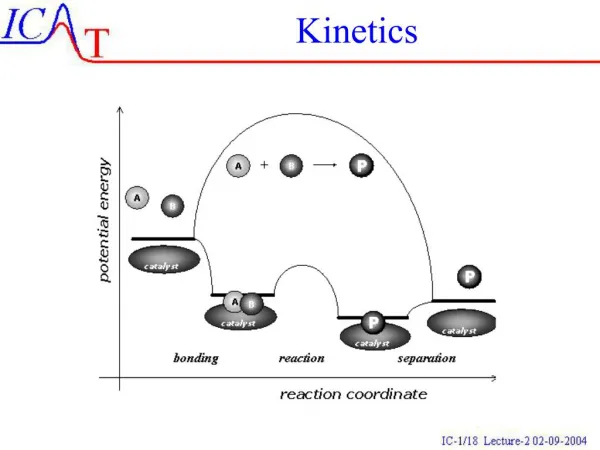
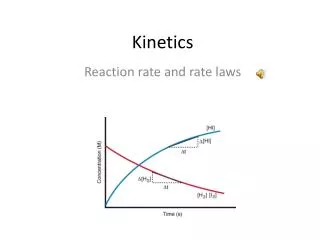
Kinetics - graphs Sketch volume-time graphs for: • hydrogen produced during a magnesium and hydrochloric acid reaction both reactants are in stoichiometric ratio’s • same reaction carried out with a twice as concentrated acid solution (acid in excess) • same reaction as 1 but carried out with a twice as concentrated acid solution (acid as limiting reagent) • the first reaction carried out with half the acid concentration but the acid as the limiting reagent
Kinetics - graphs Sketch mass-time graphs for: • Mass of flask + contents when hydrochloric acid reacts with calcium carbonate (=limiting reagent). • Show how you would determine the initial rate of the reaction • Mass of CO2 produced during same reaction. • On the above graph, add a line showing change in mass of CO2 with greater surface area/smaller particles of CaCO3.
Kinetics - graphs • Sketch temperature-time graph for sodium thiosulphate and HCl reaction. • Sketch a volume-time graph for oxygen production during decomposition of hydrogen peroxide: • without a catalyst • with liver • with chopped up liver